None
Comparison
Comparison
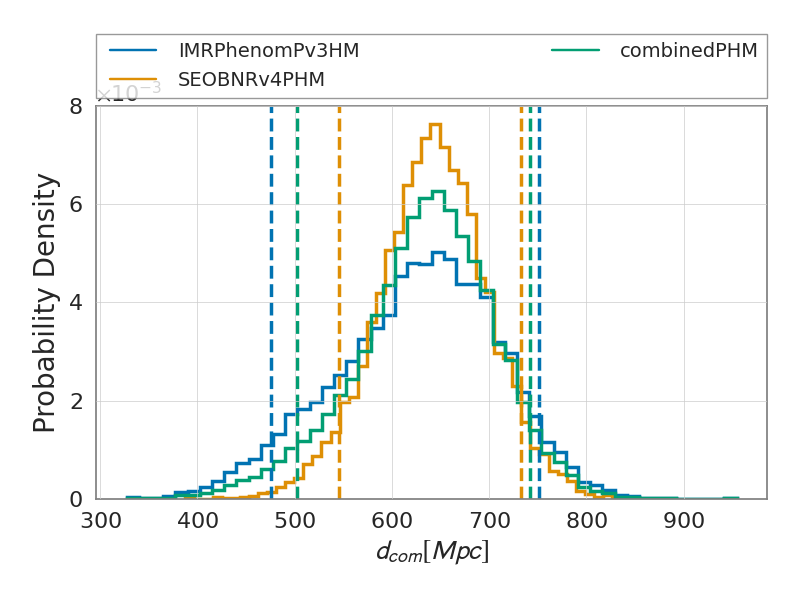
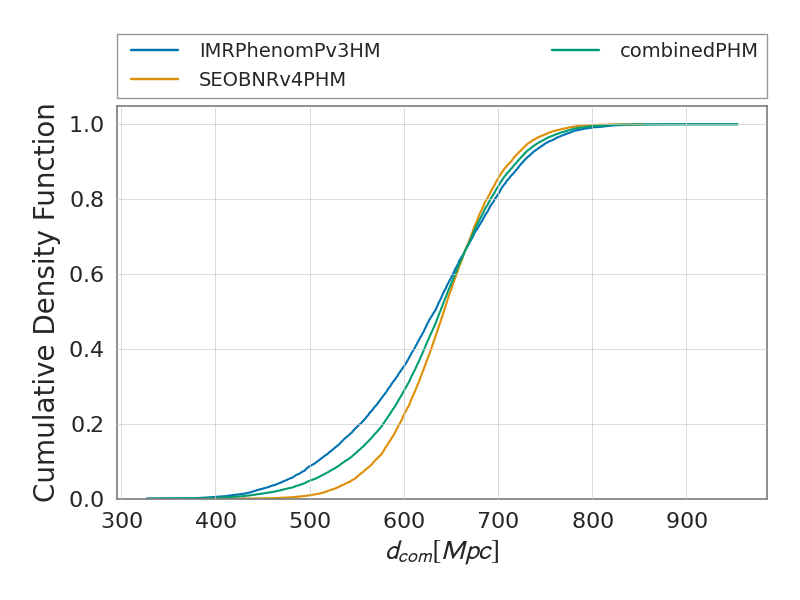
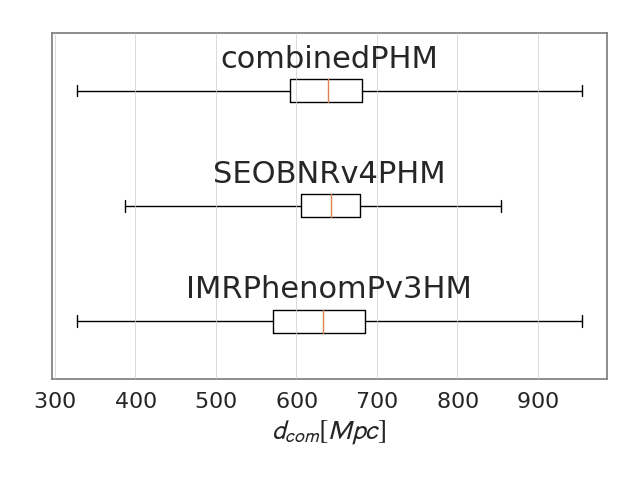
Below are the summary comparison plots
comoving_distance
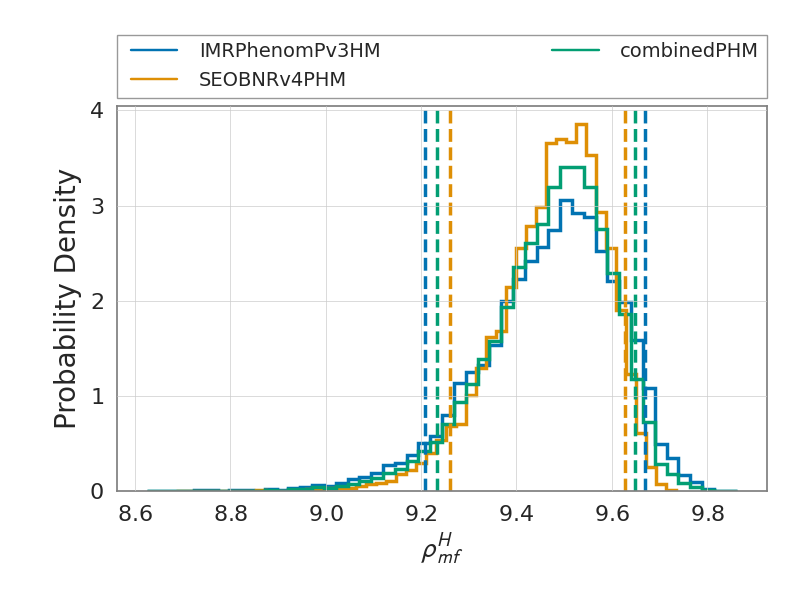
The figures below show the summary plots for the run
H1_matched_filter_snr
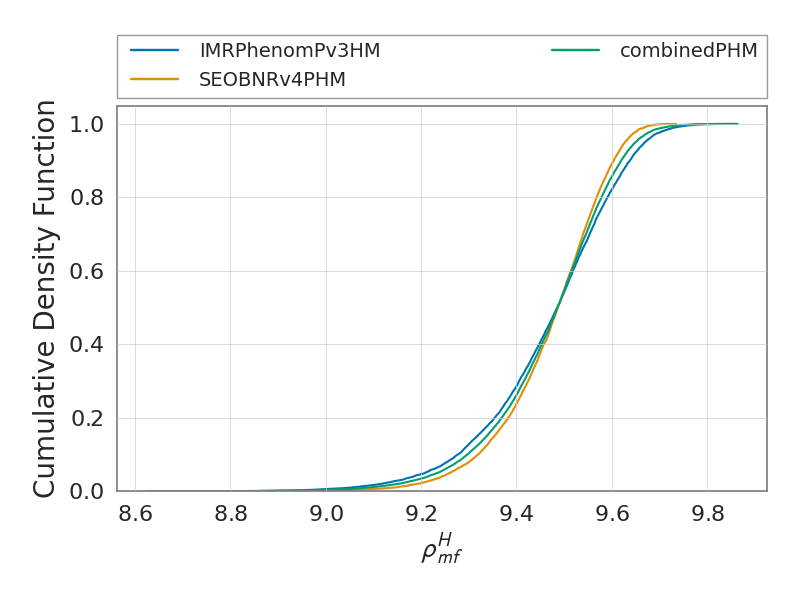
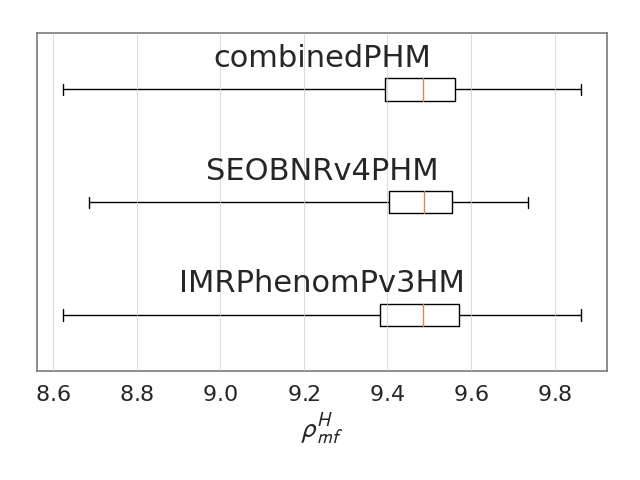
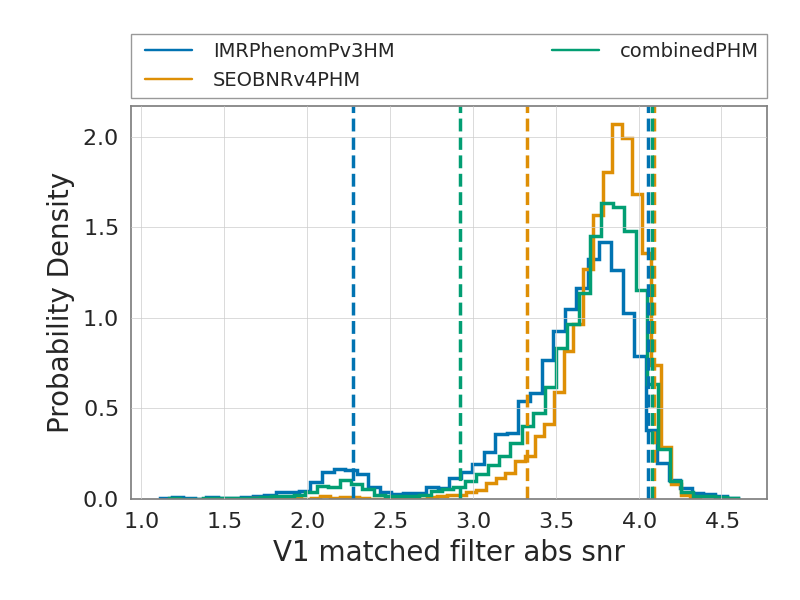
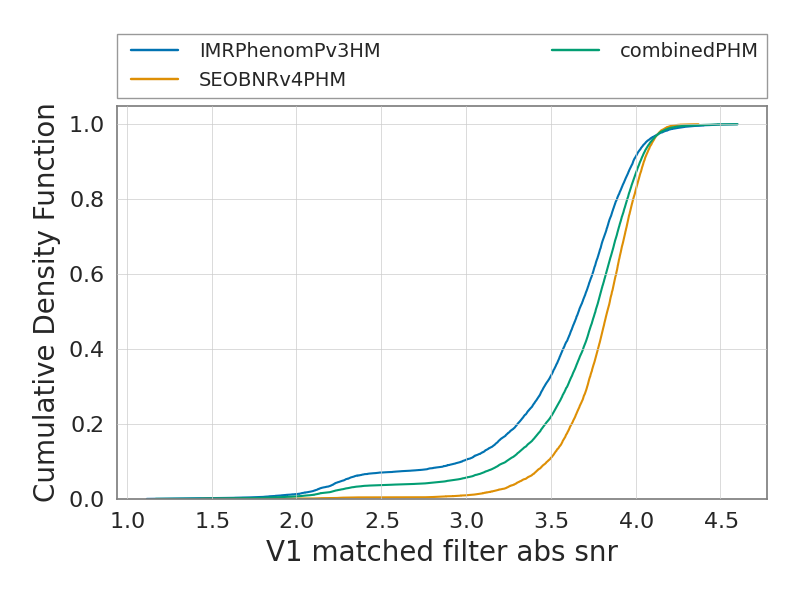
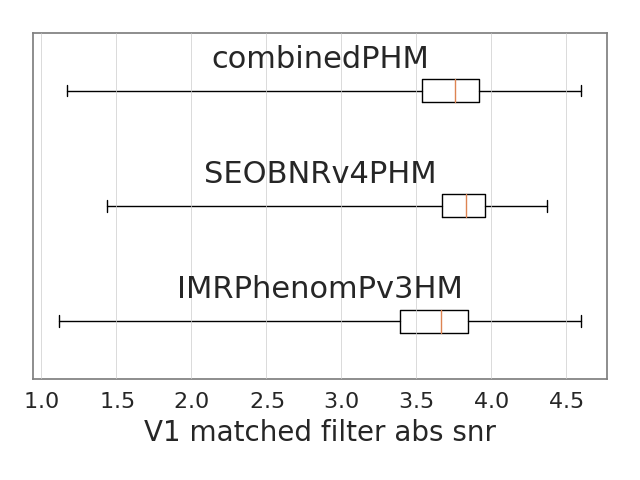
The figures below show the summary plots for the run
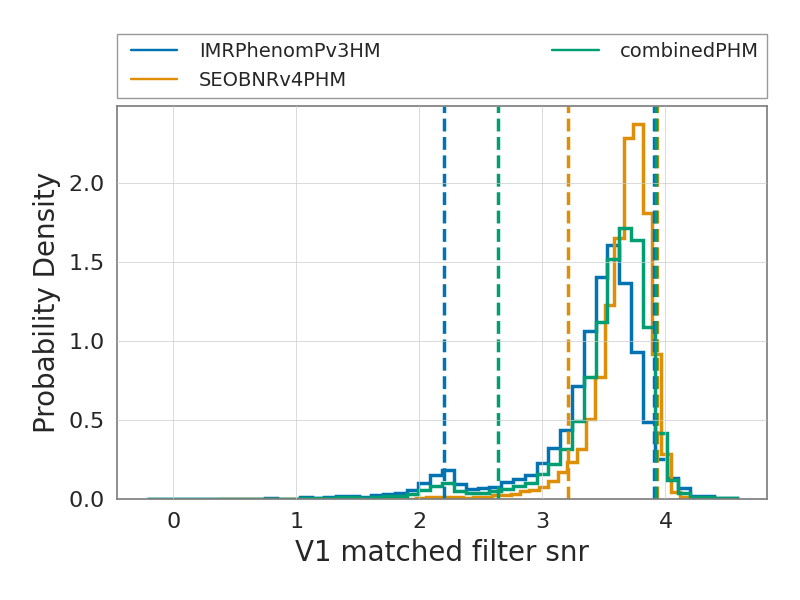
V1_matched_filter_abs_snr
The figures below show the summary plots for the run
recalib_V1_frequency_6
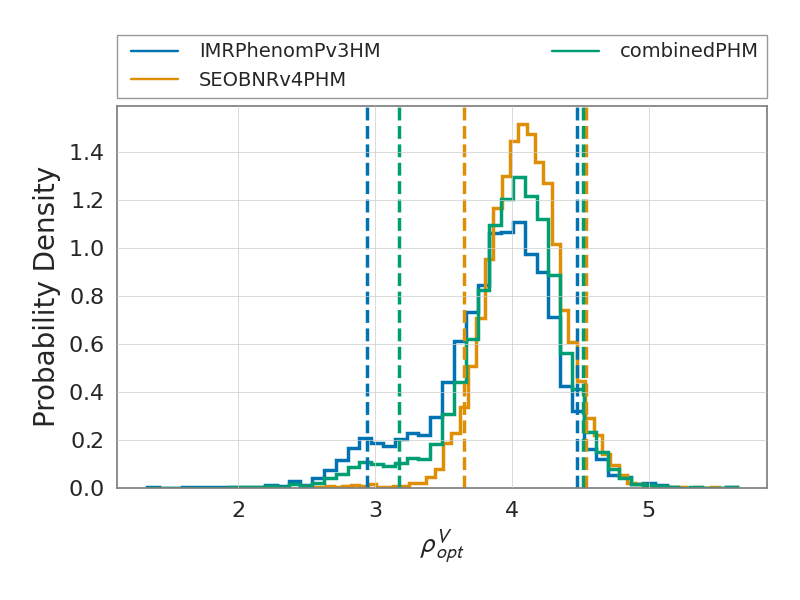
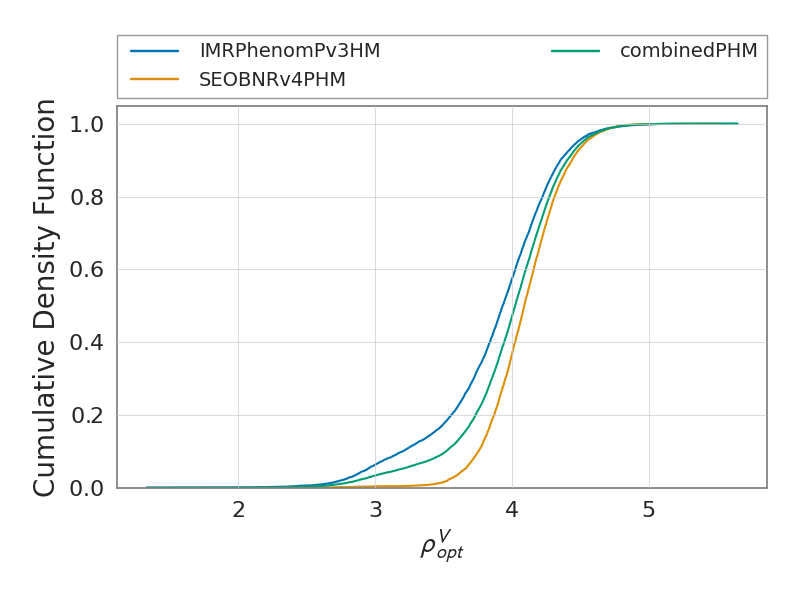
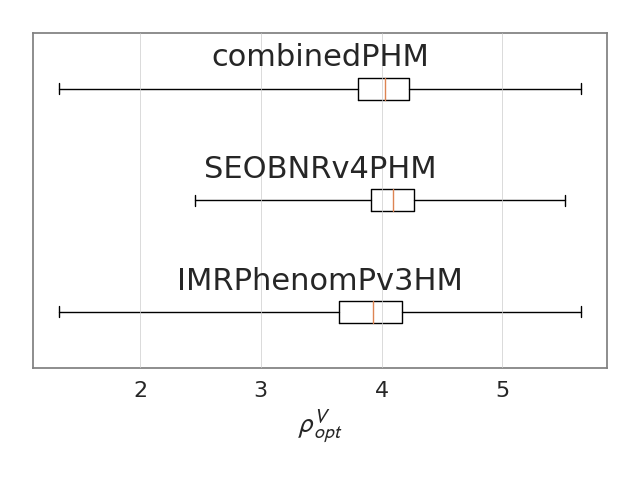
The figures below show the summary plots for the run
V1_optimal_snr
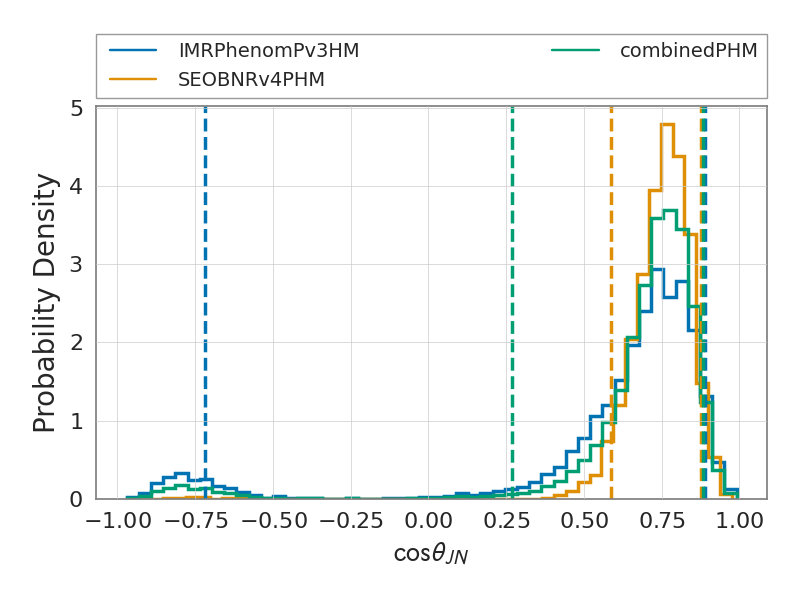
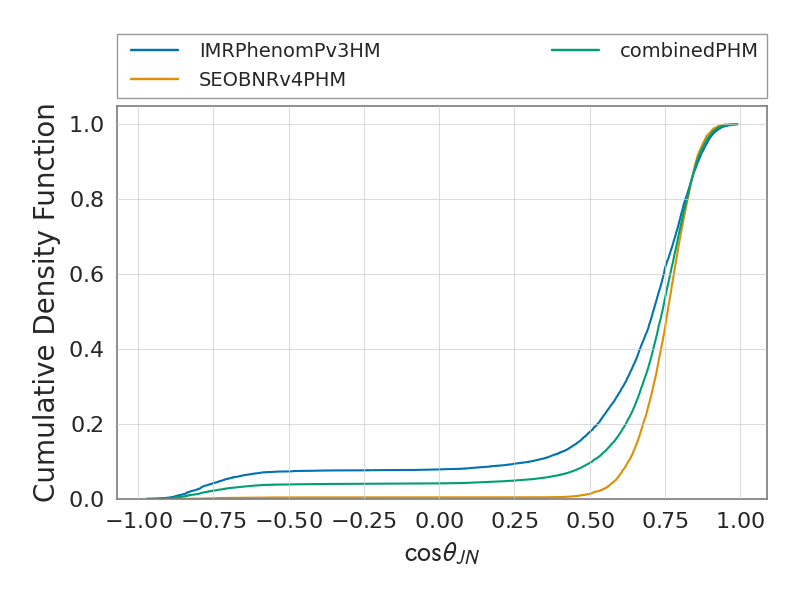
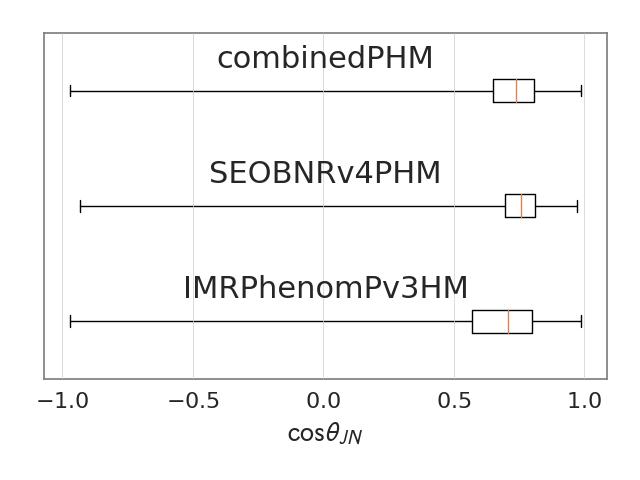
The figures below show the summary plots for the run
cos_theta_jn
The figures below show the summary plots for the run
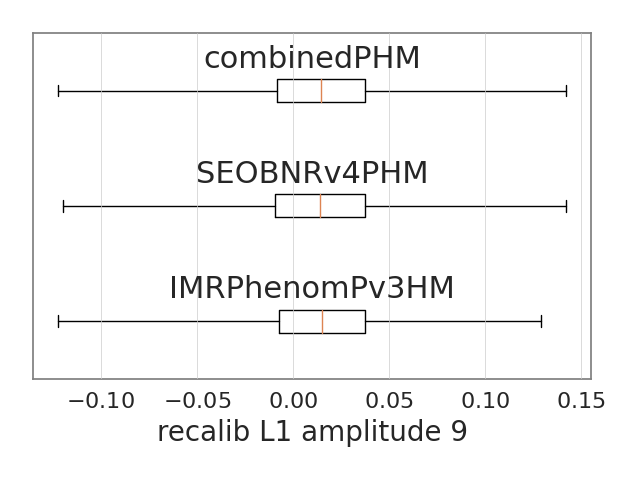
recalib_L1_frequency_9
The figures below show the summary plots for the run
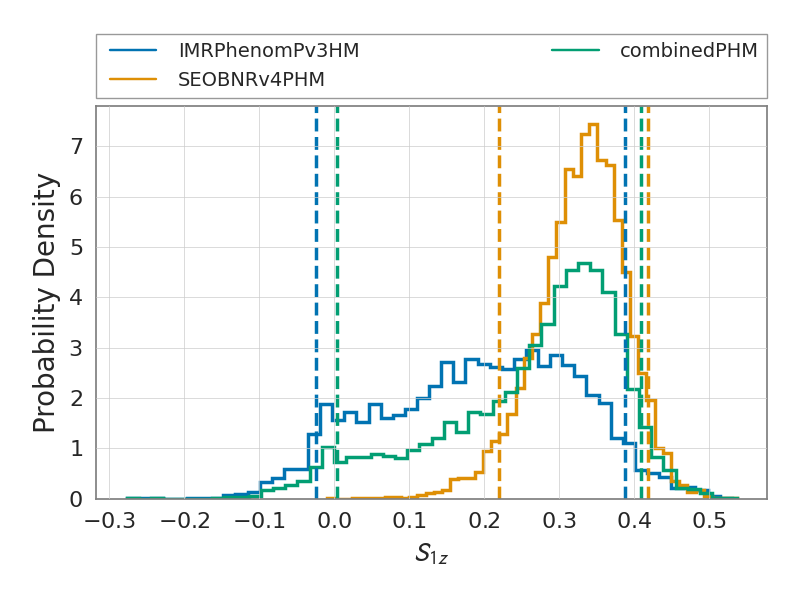
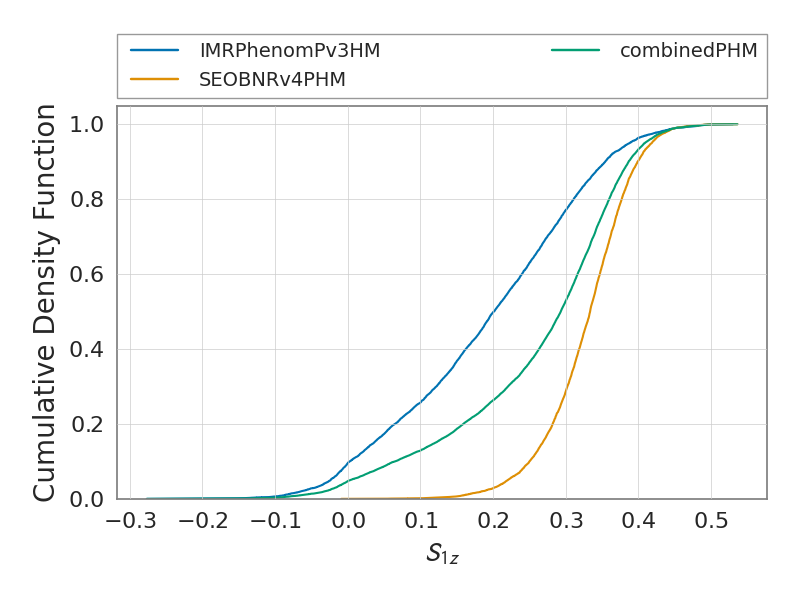
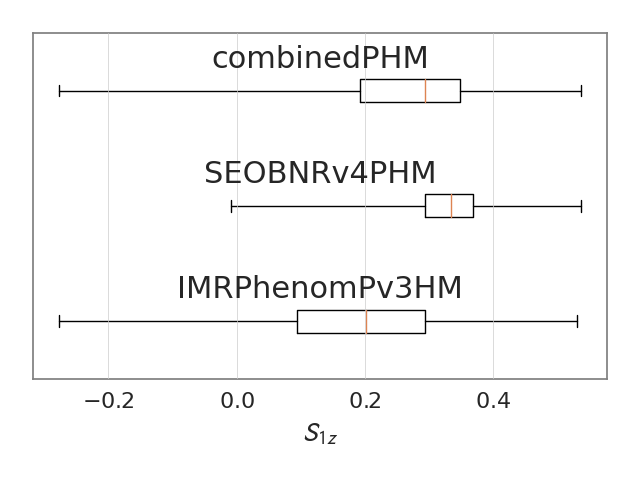
spin_1z
The figures below show the summary plots for the run
L1_matched_filter_snr
The figures below show the summary plots for the run
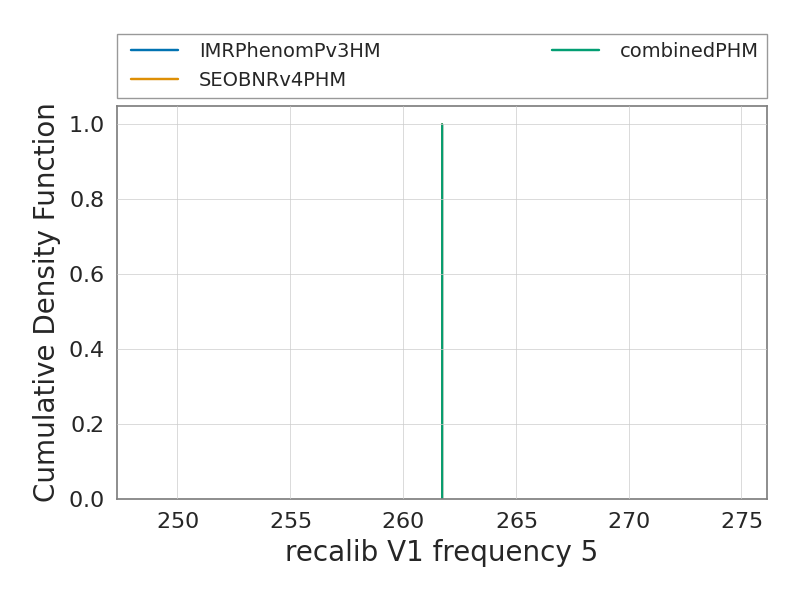
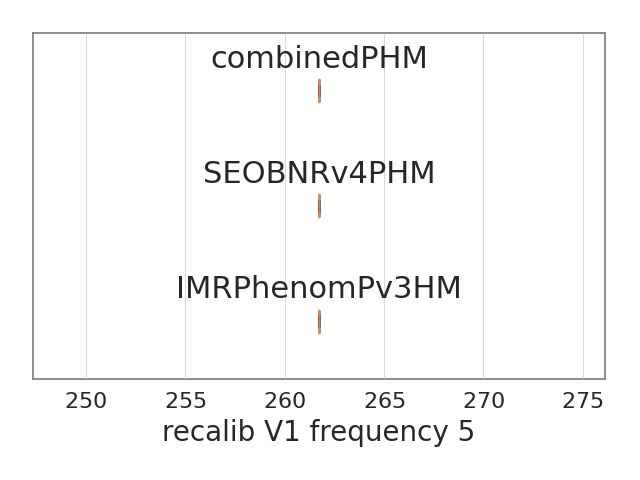
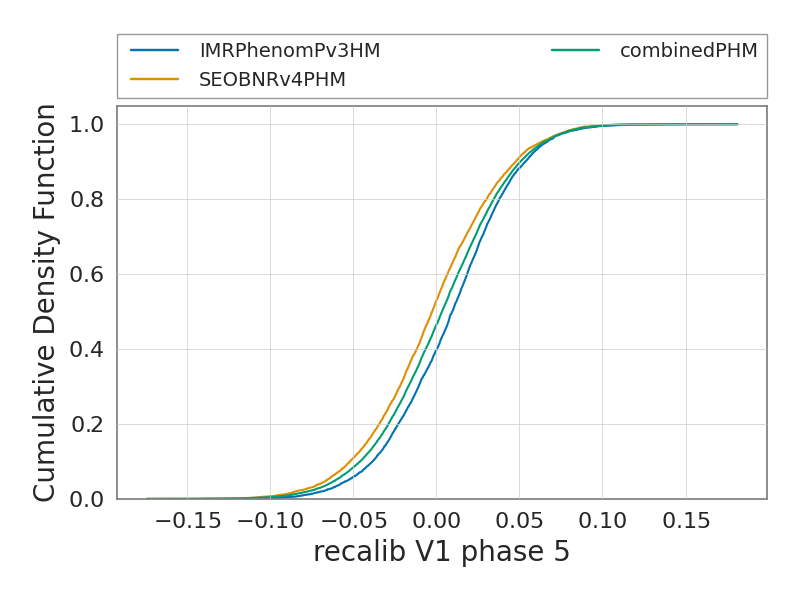
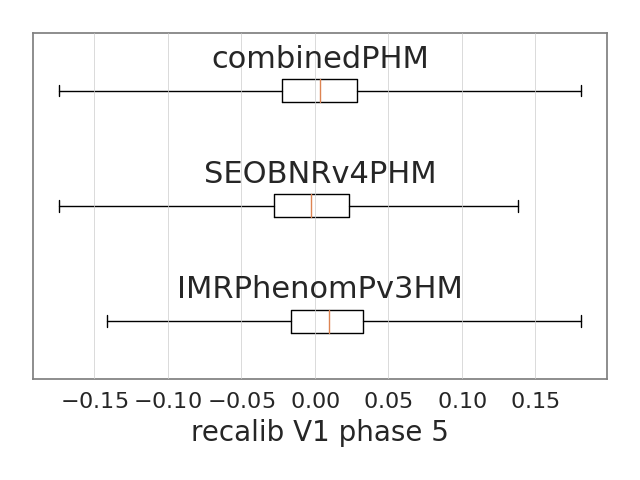
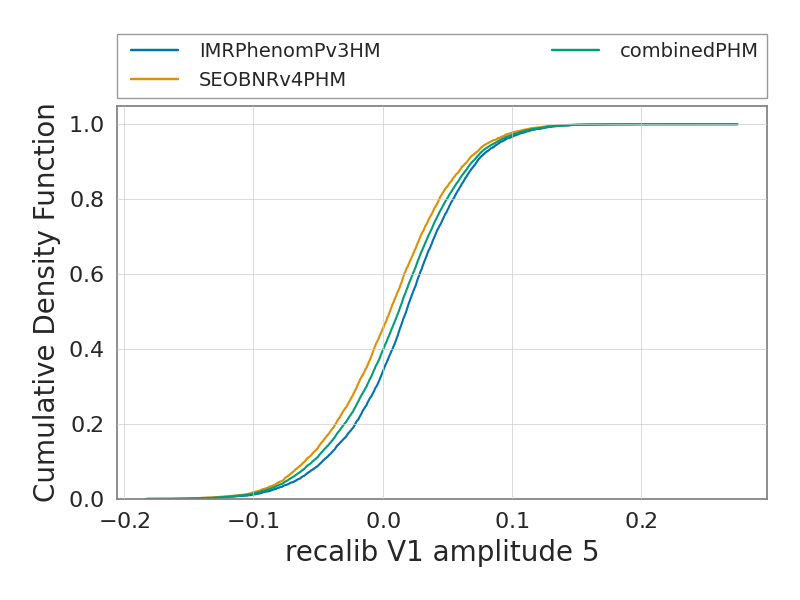
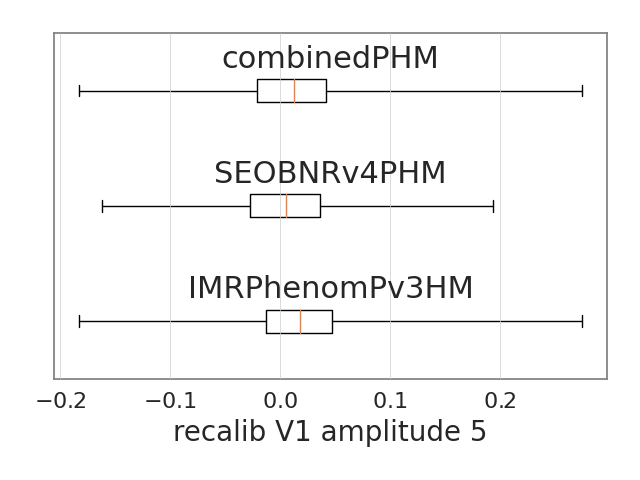
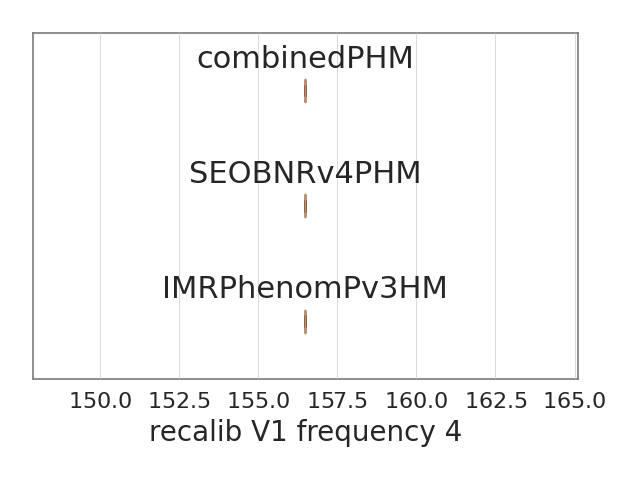
recalib_V1_frequency_5
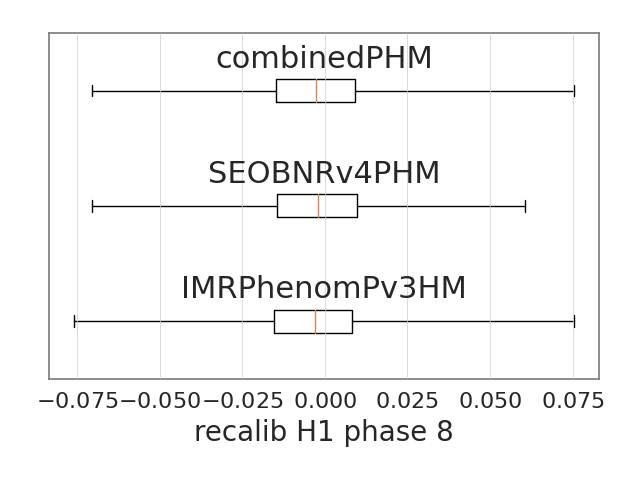
The figures below show the summary plots for the run
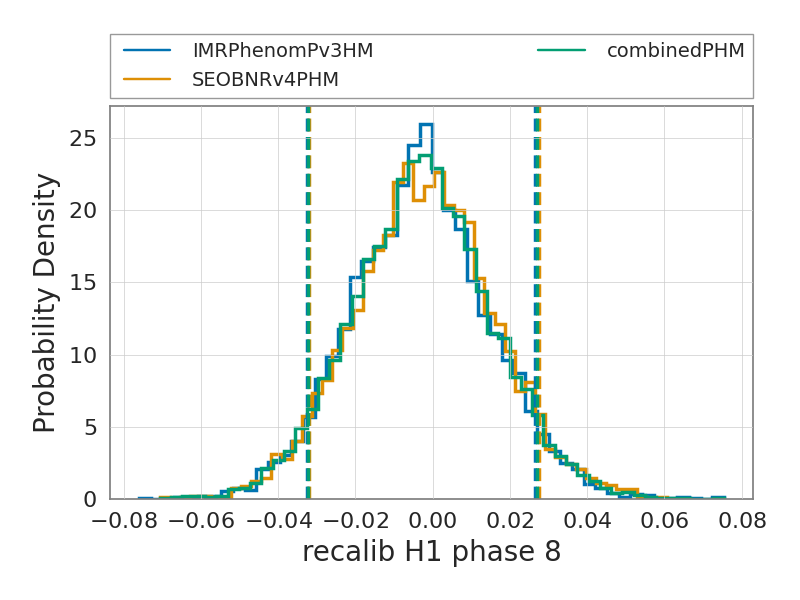
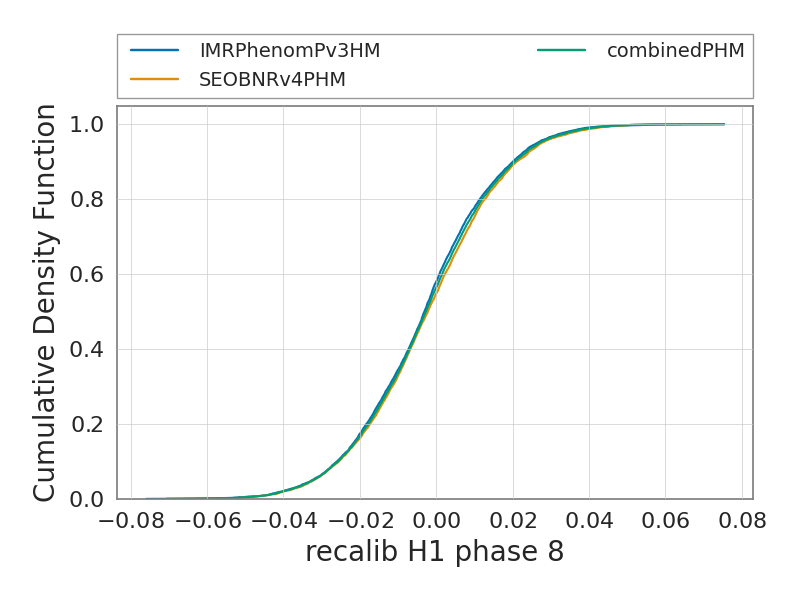
recalib_H1_phase_8
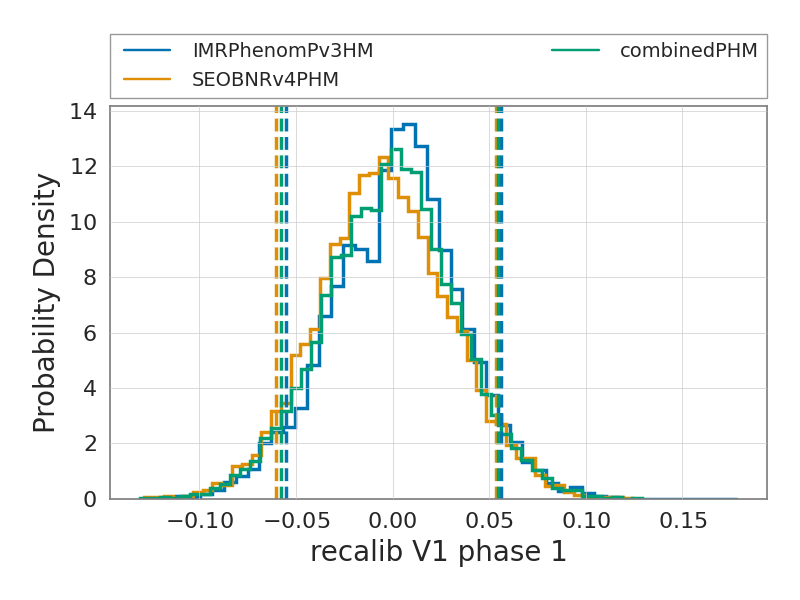
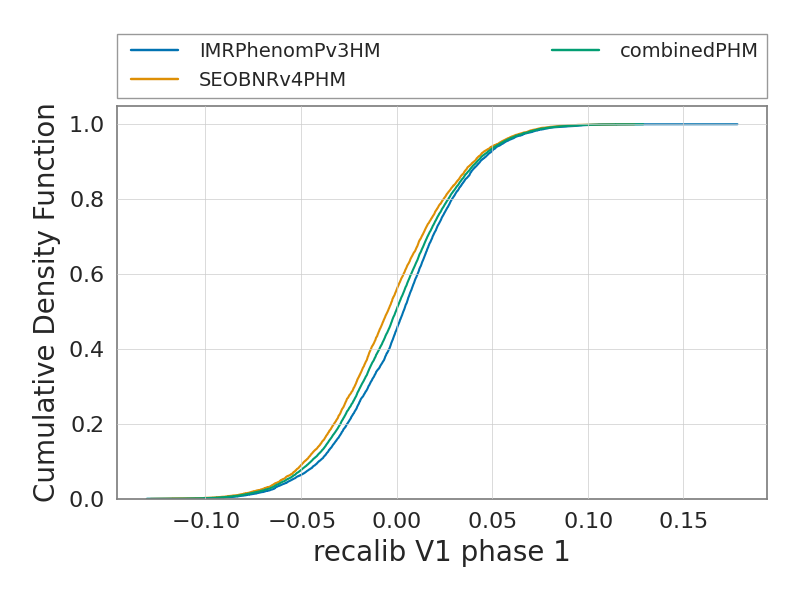
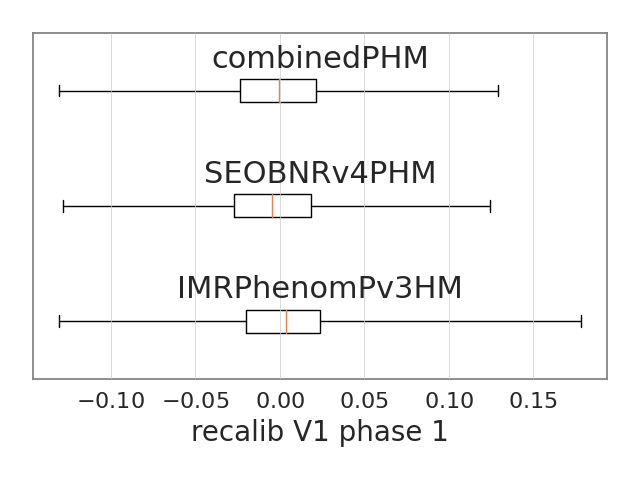
The figures below show the summary plots for the run
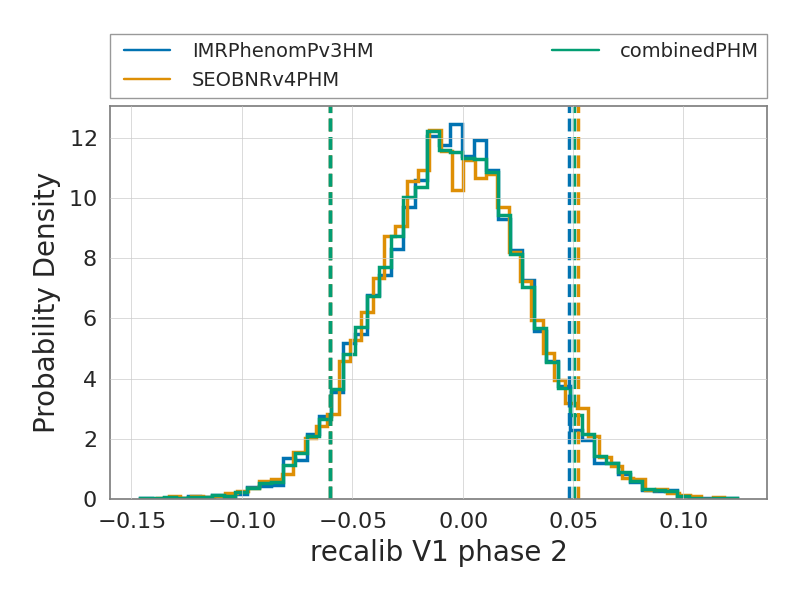
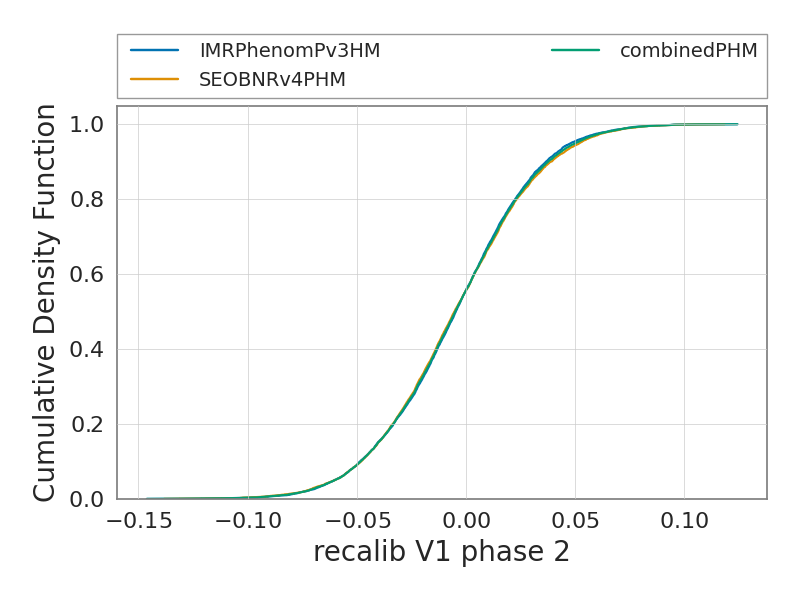
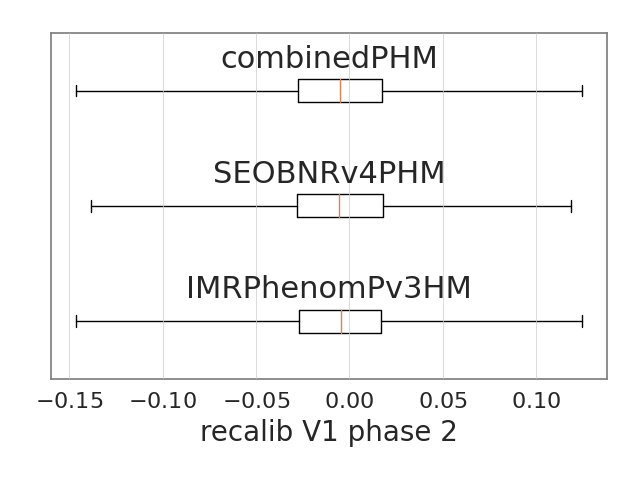
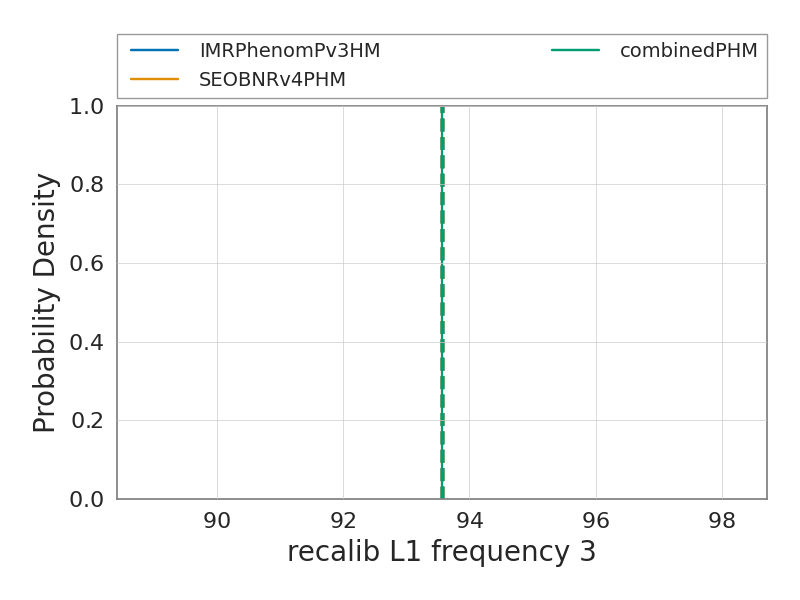
recalib_V1_phase_1
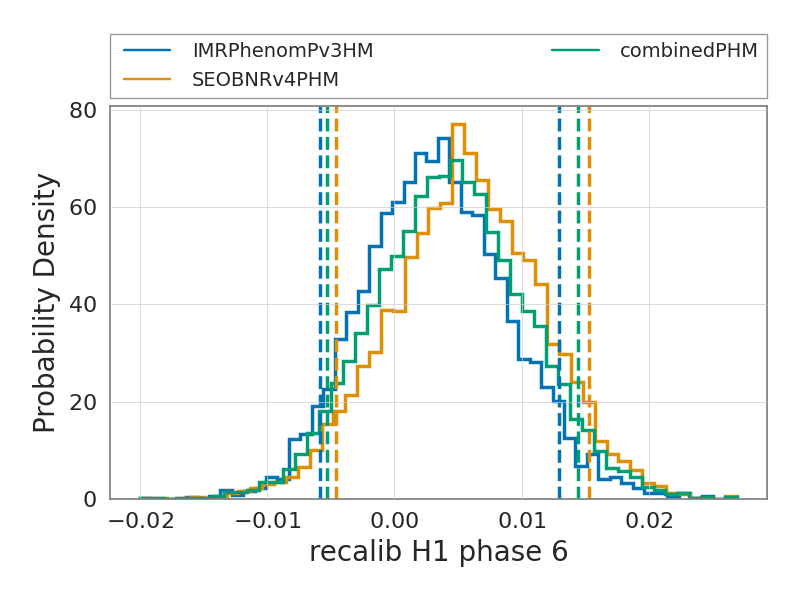
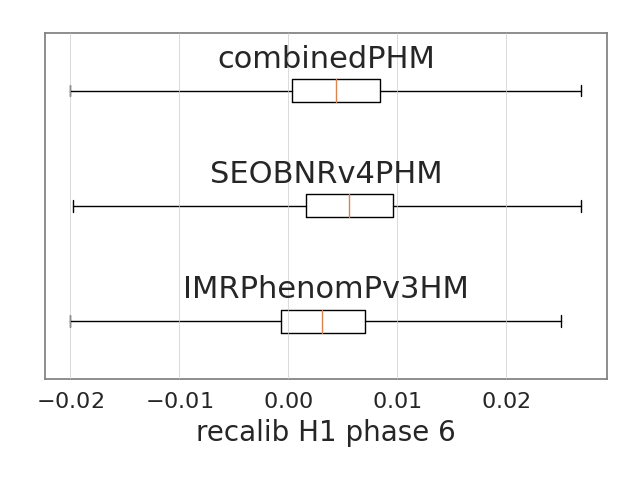
The figures below show the summary plots for the run
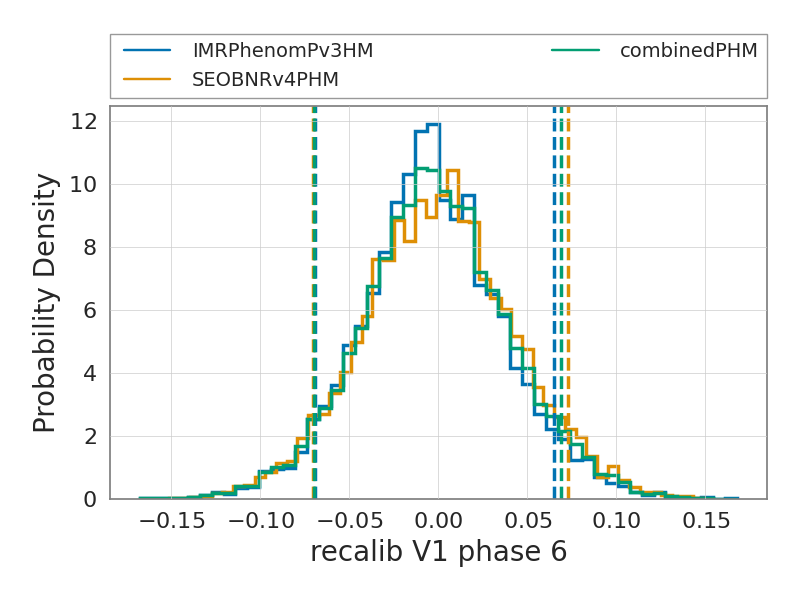
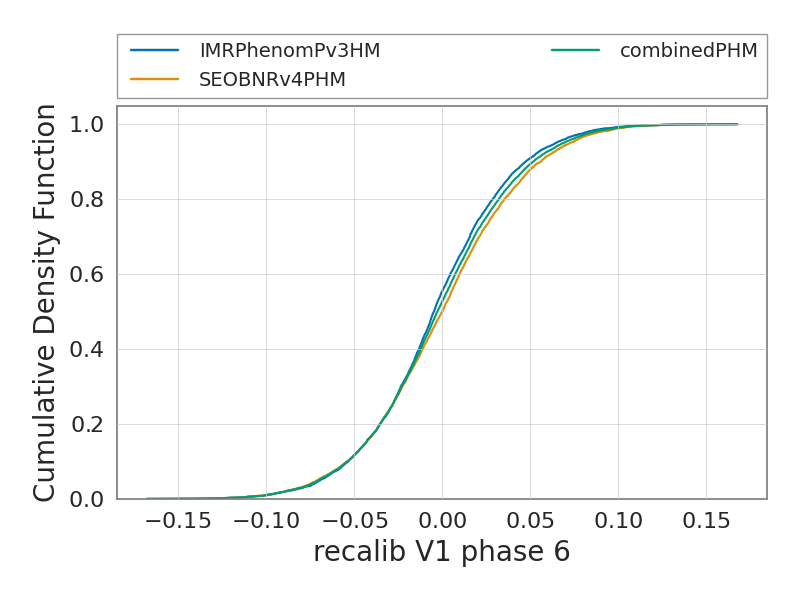
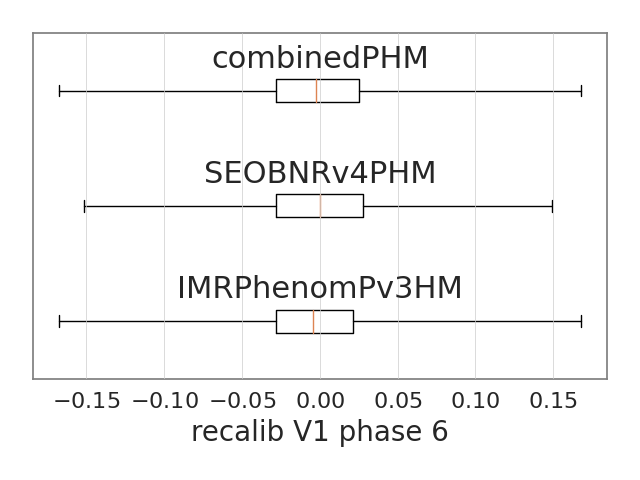
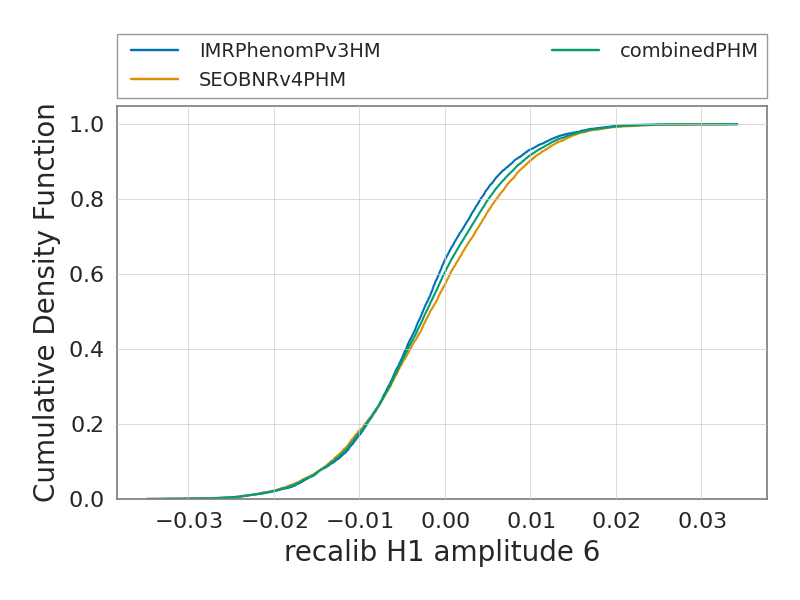
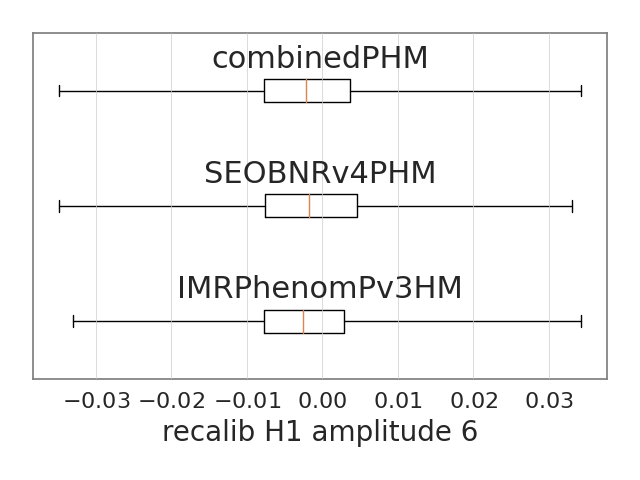
recalib_H1_phase_6
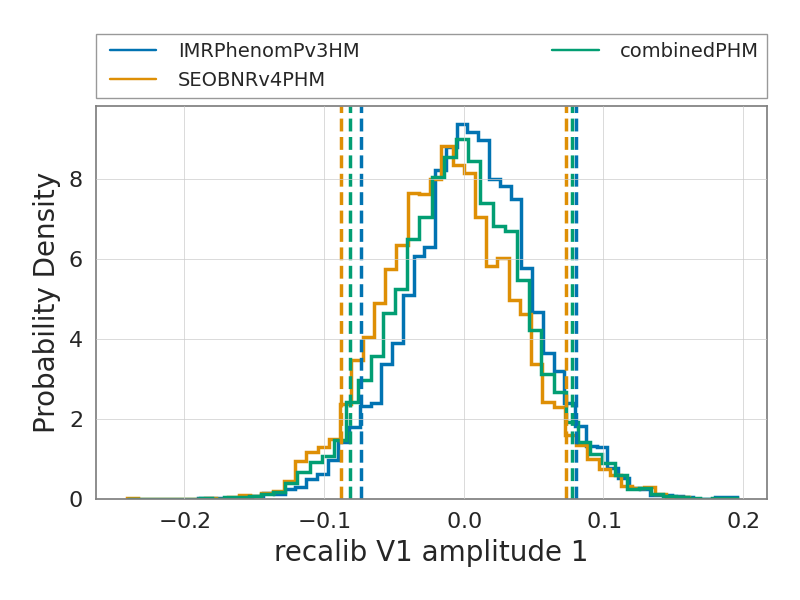
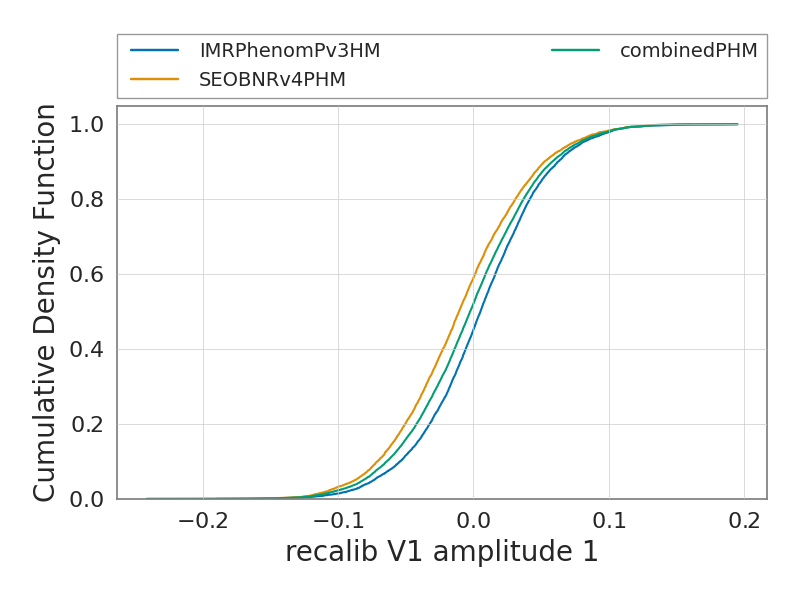
The figures below show the summary plots for the run
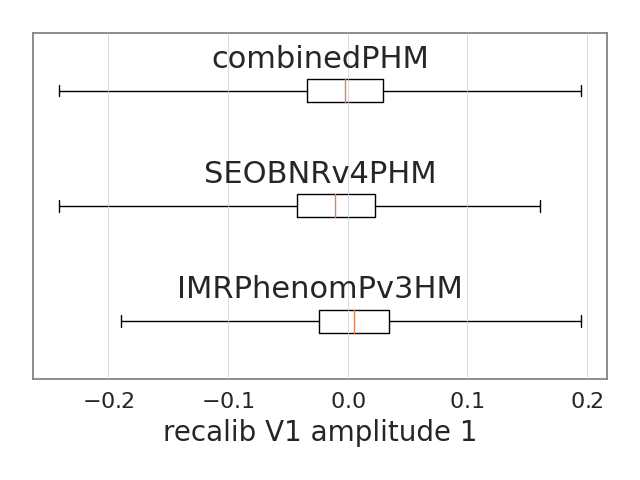
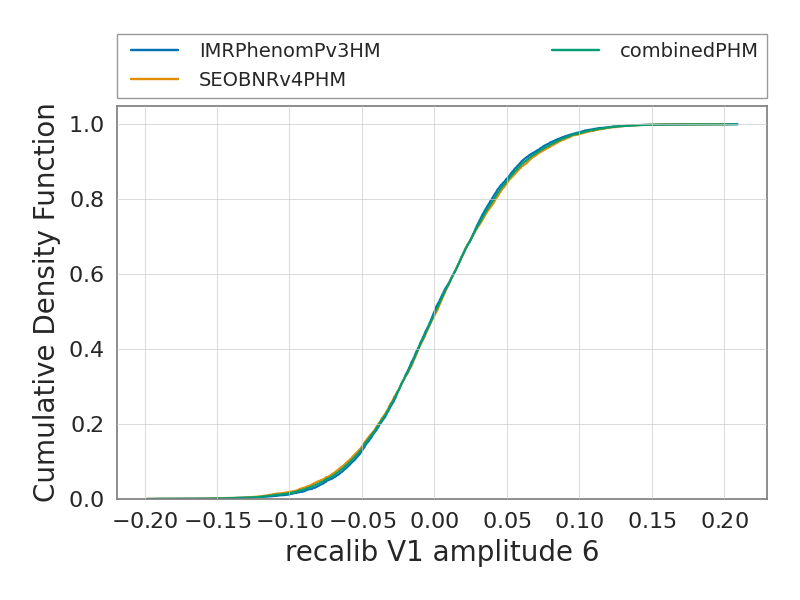
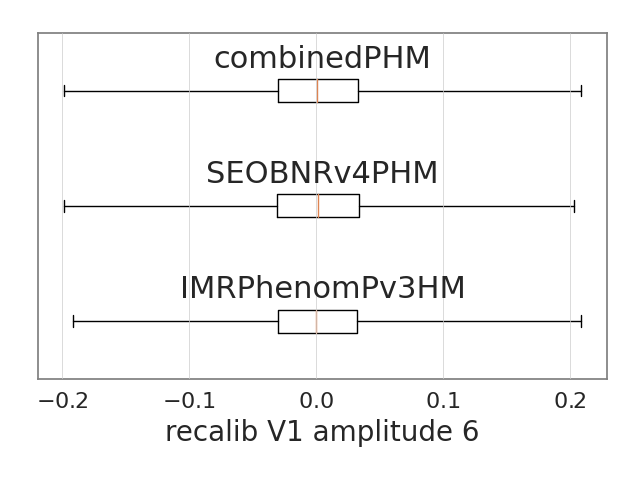
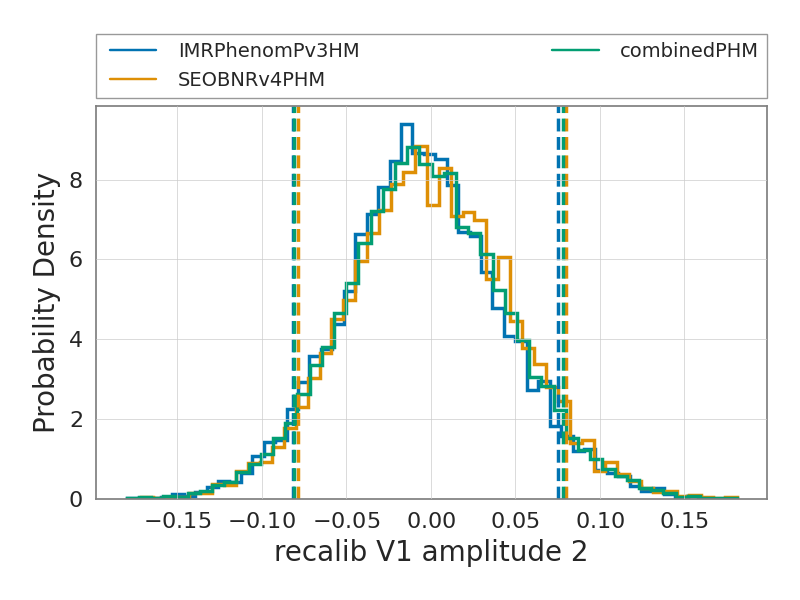
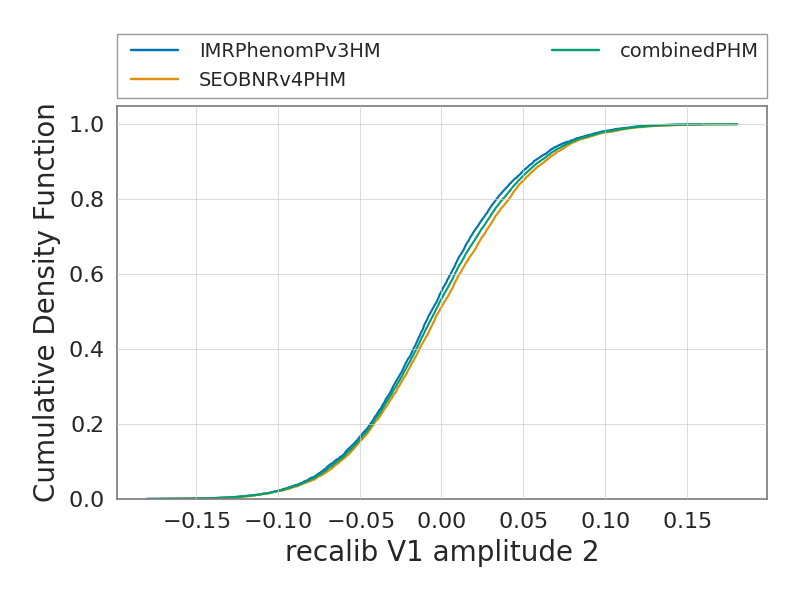
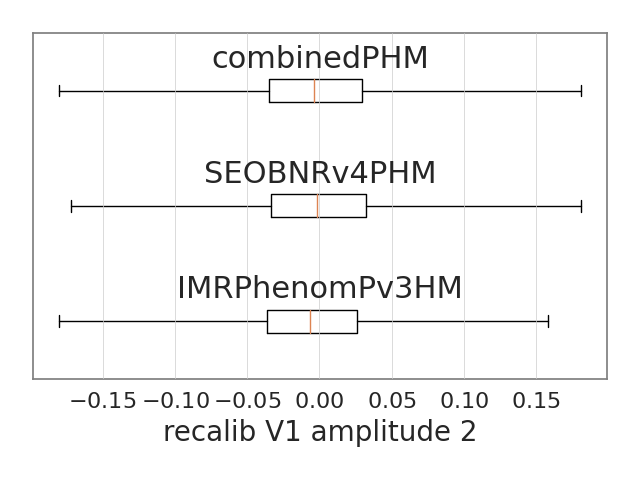
recalib_V1_amplitude_1
The figures below show the summary plots for the run
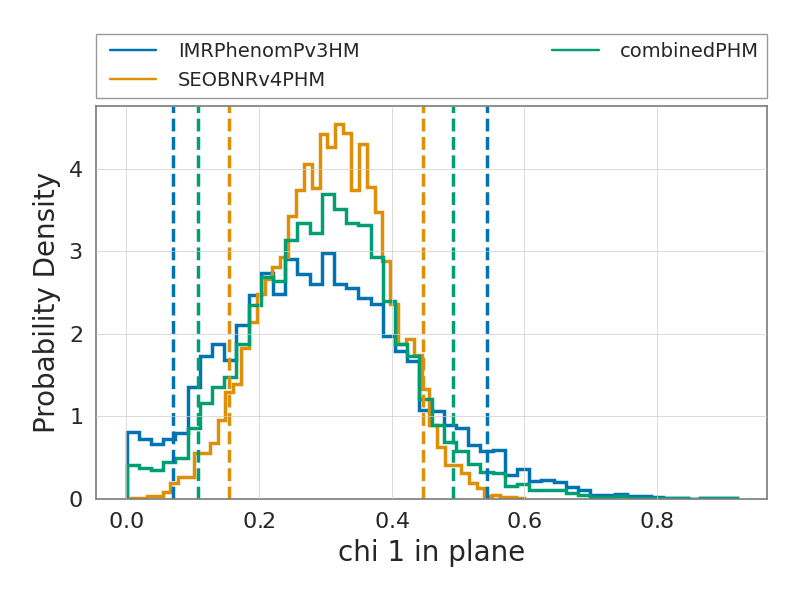
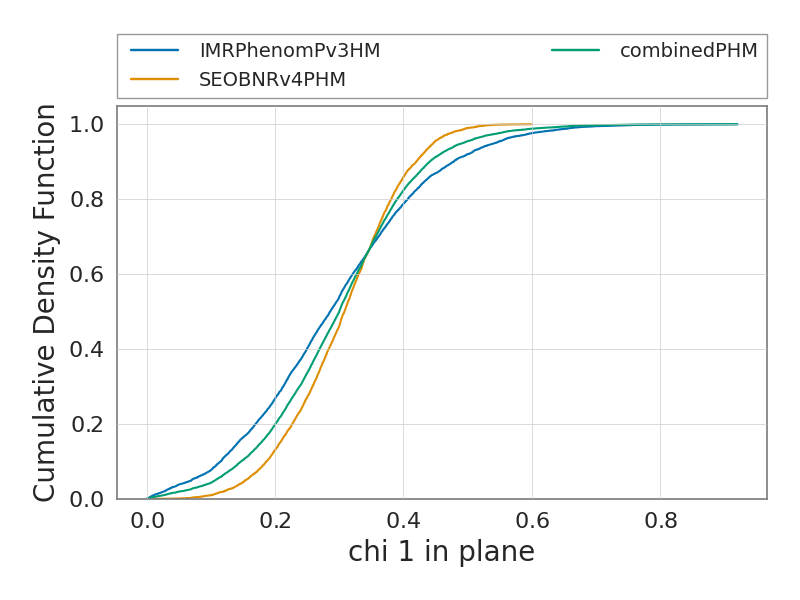
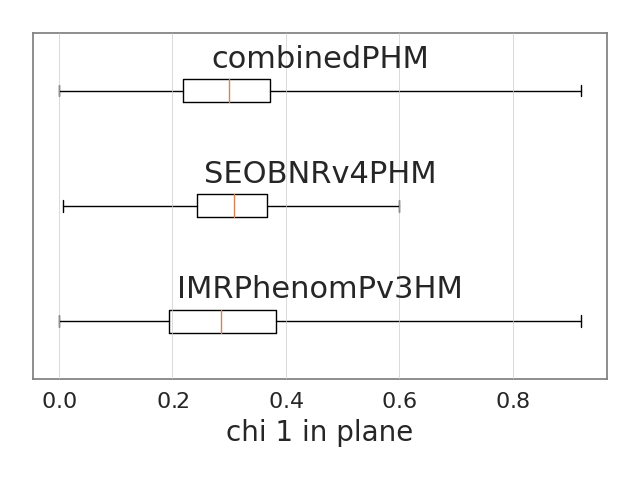
chi_1_in_plane
The figures below show the summary plots for the run
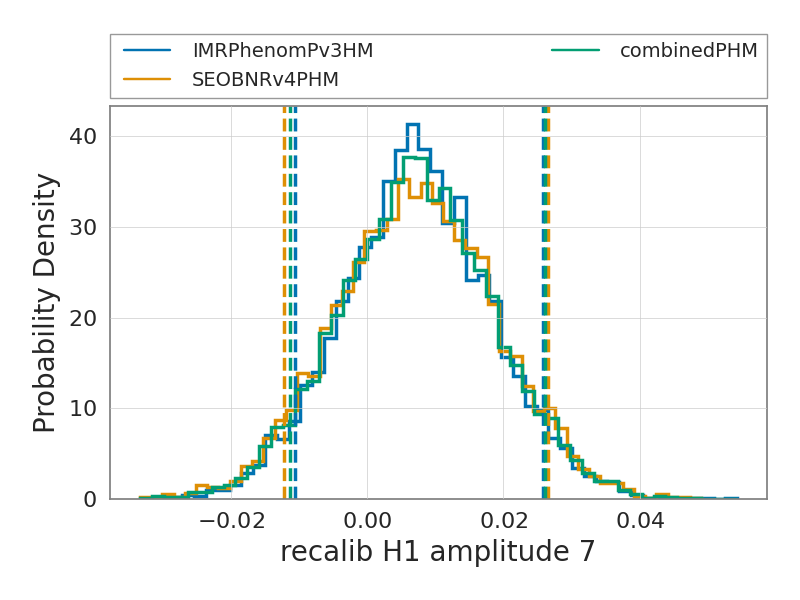
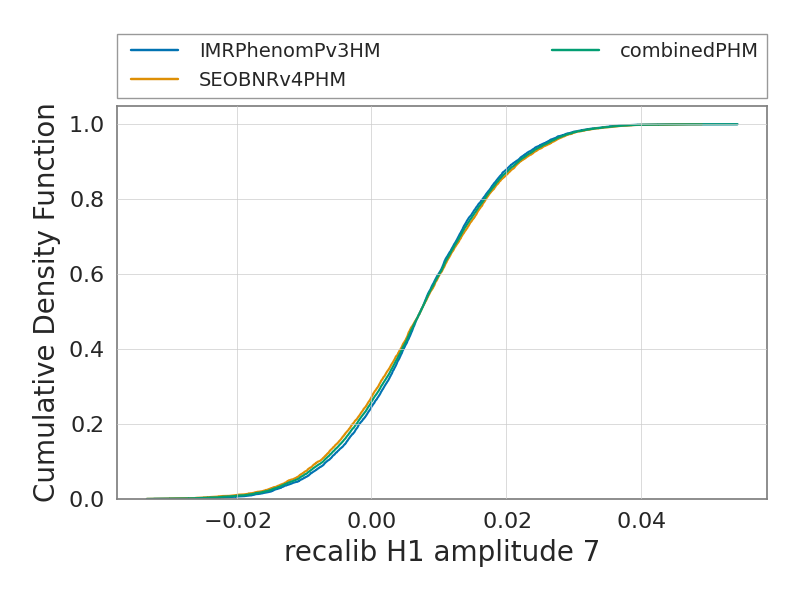
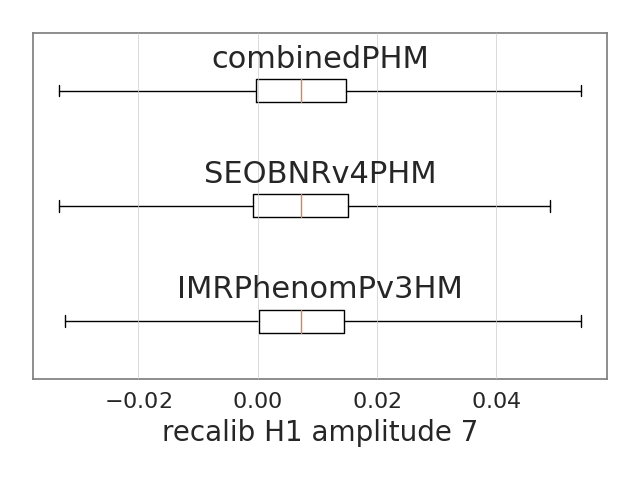
recalib_H1_frequency_7
The figures below show the summary plots for the run
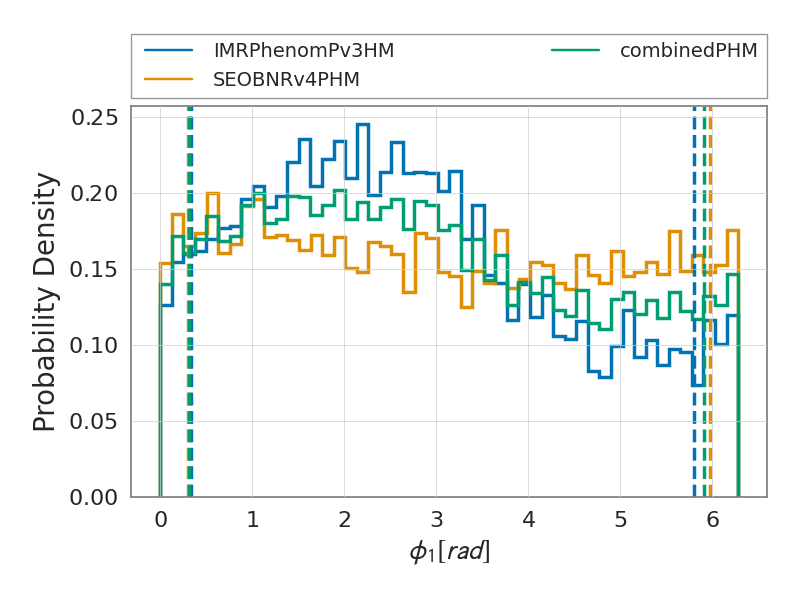
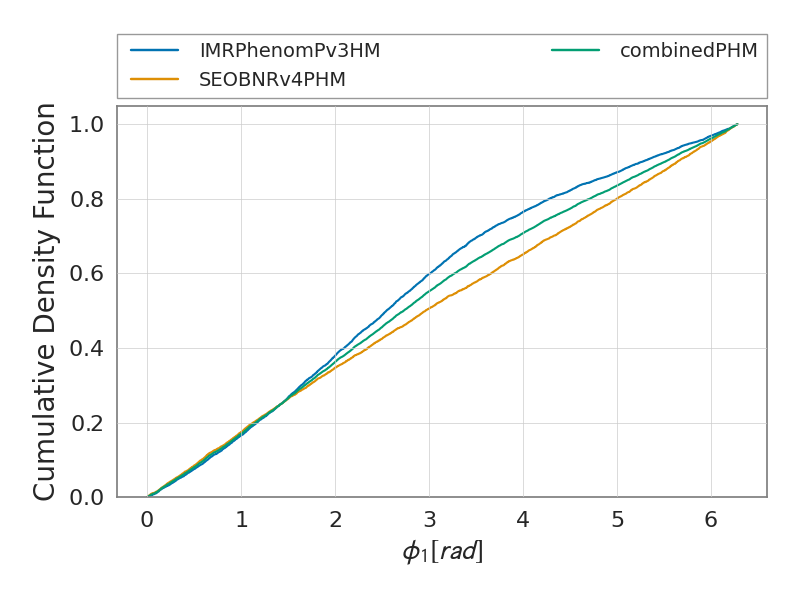
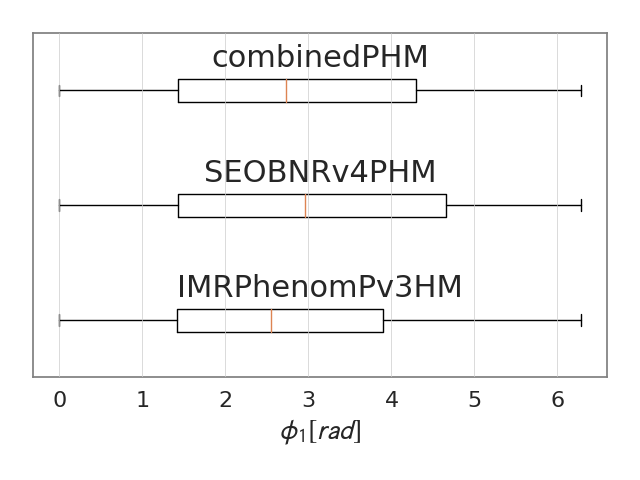
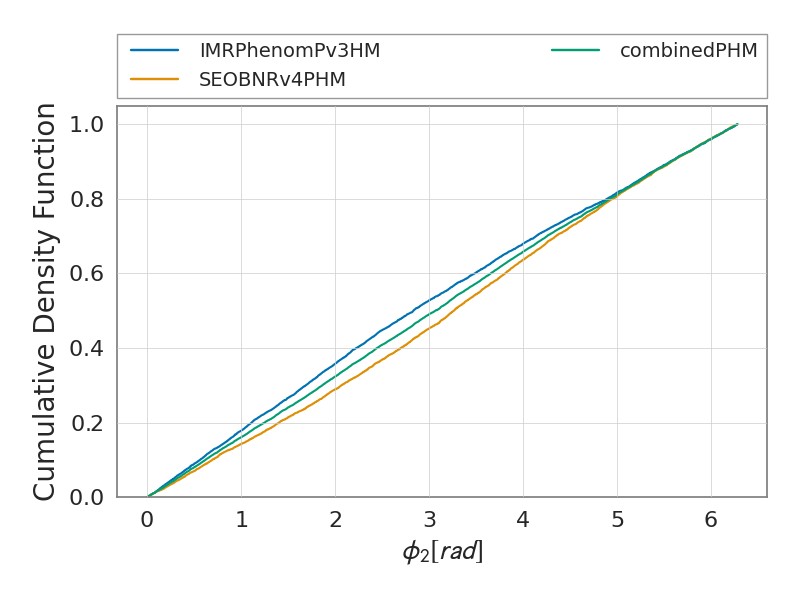
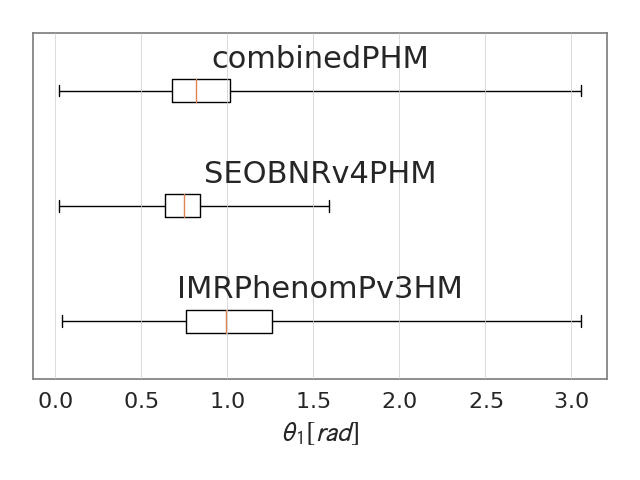
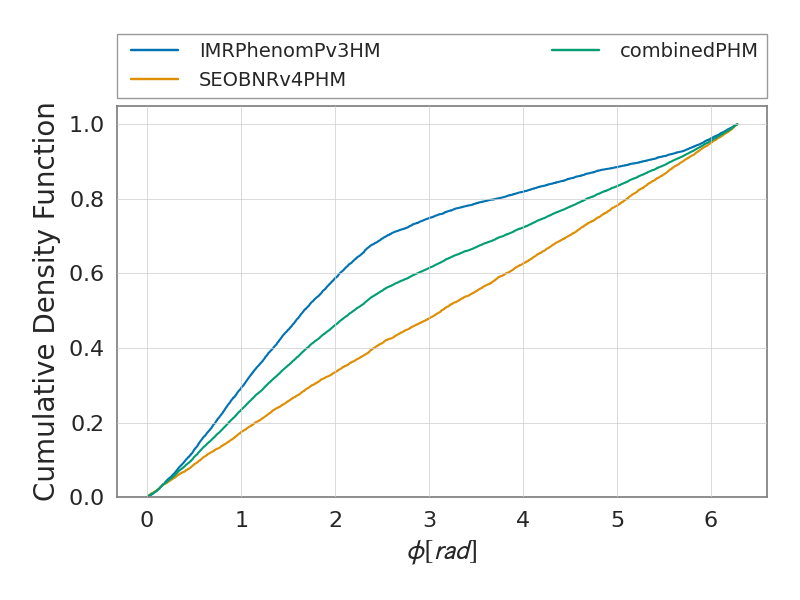
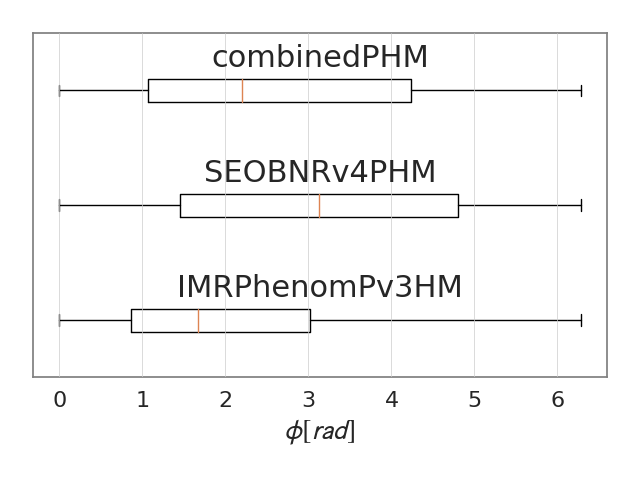
phi_1
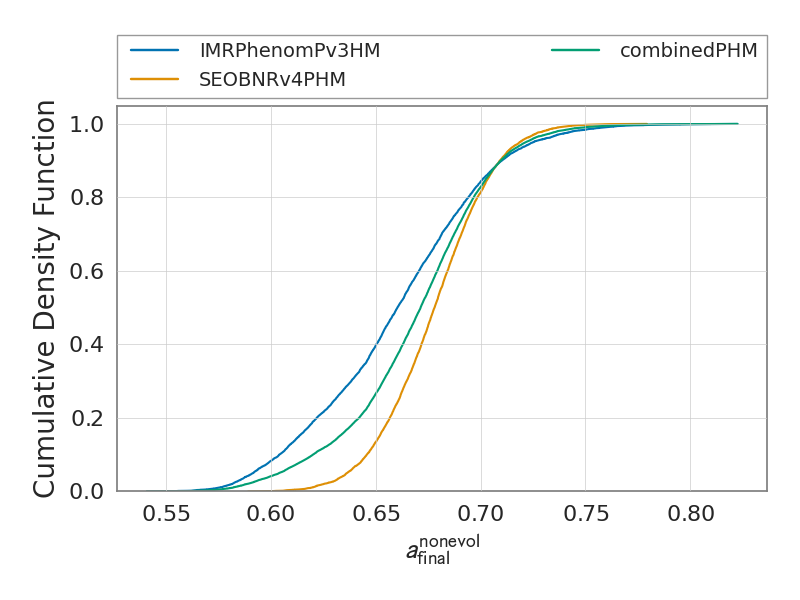
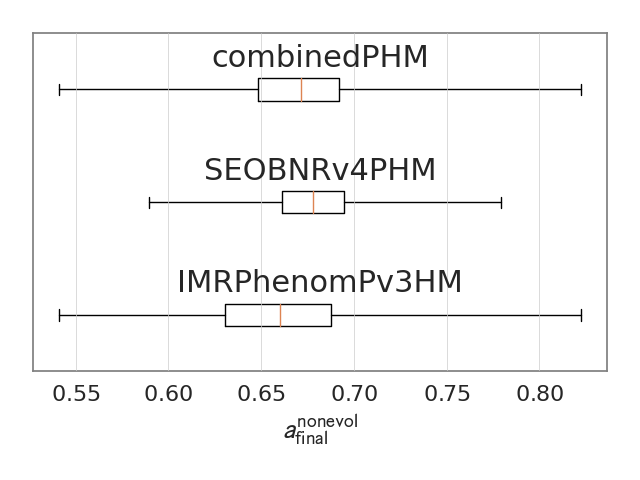
The figures below show the summary plots for the run
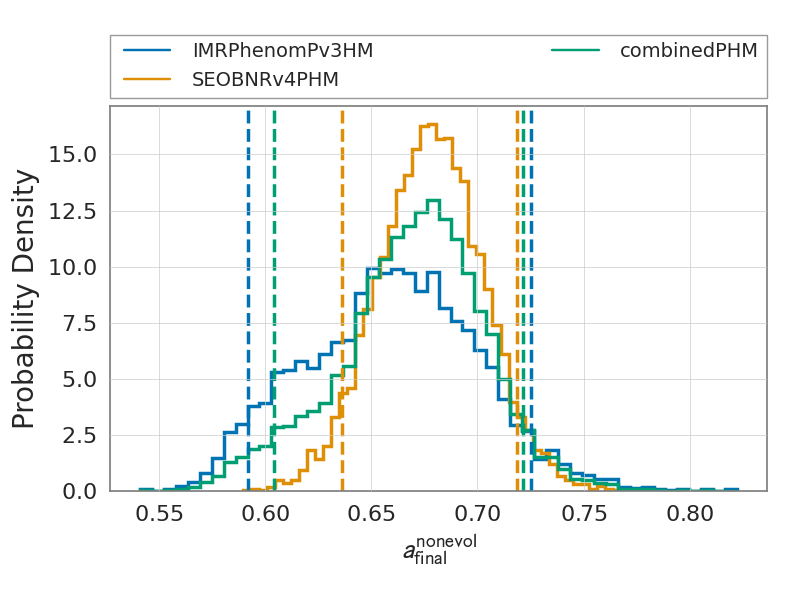
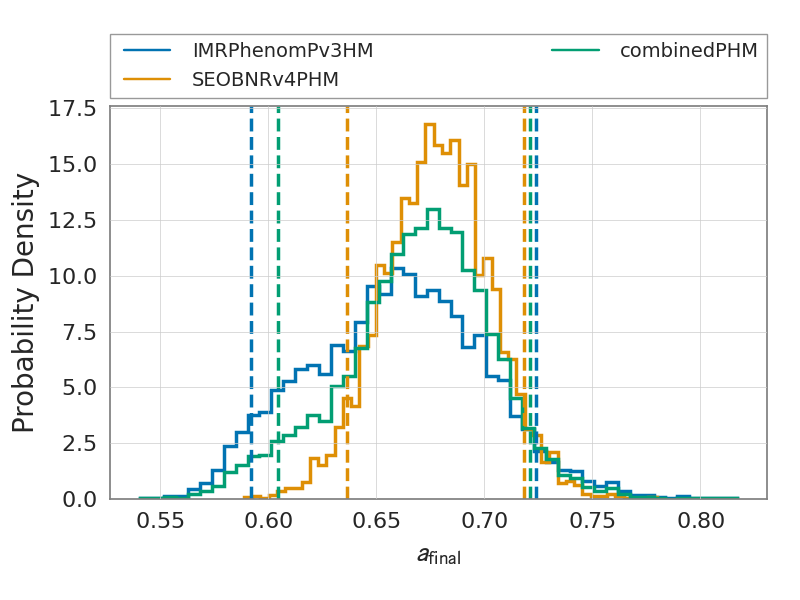
final_spin_non_evolved
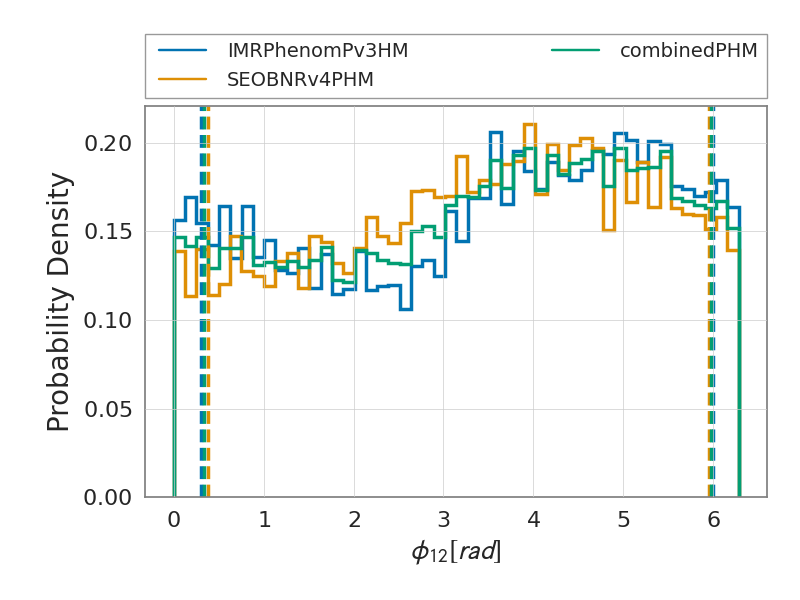
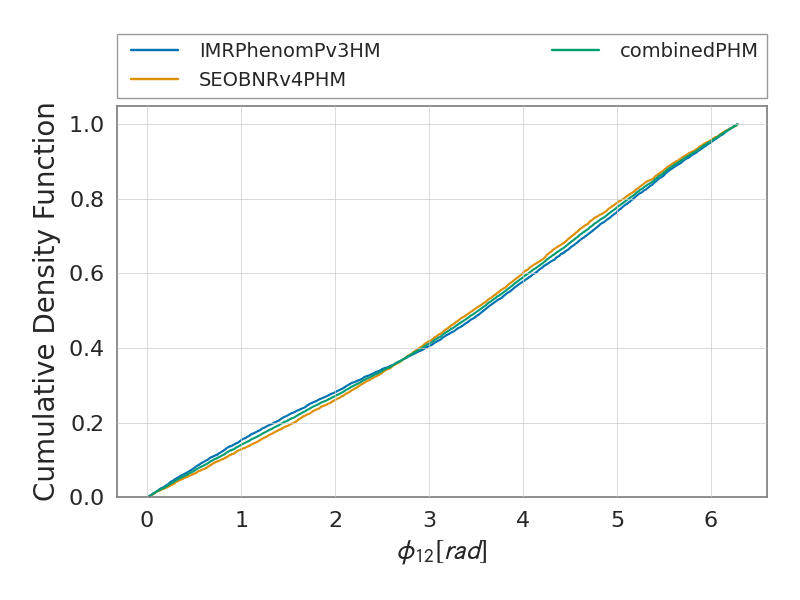
The figures below show the summary plots for the run
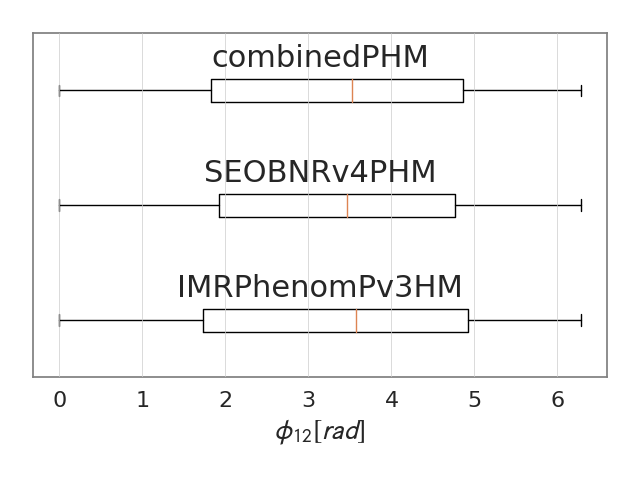
phi_12
The figures below show the summary plots for the run
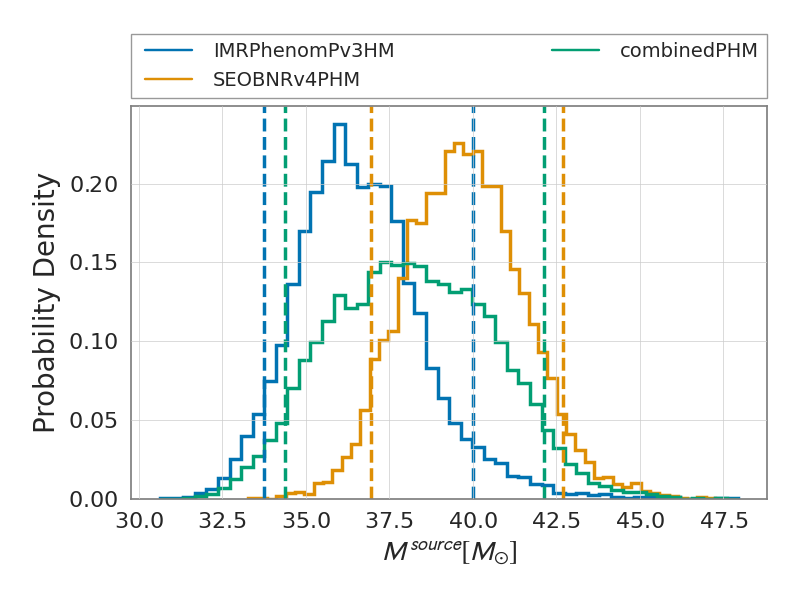
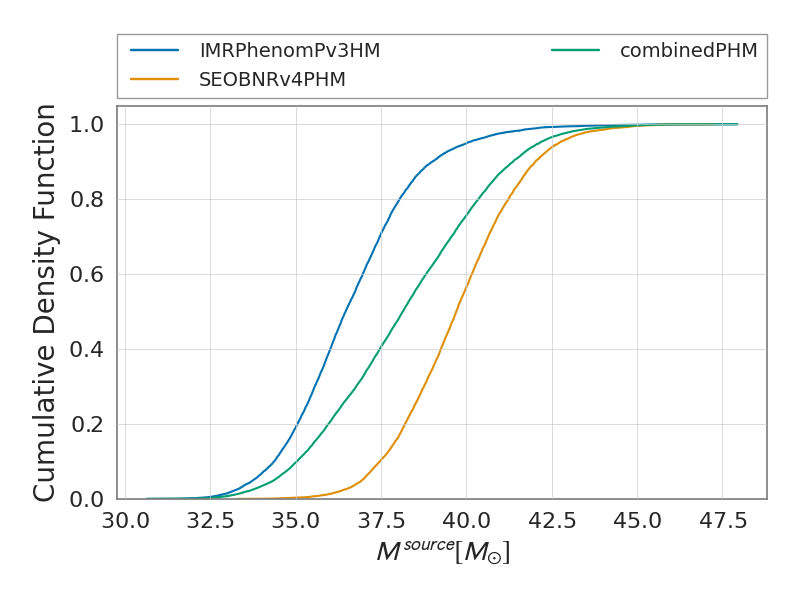
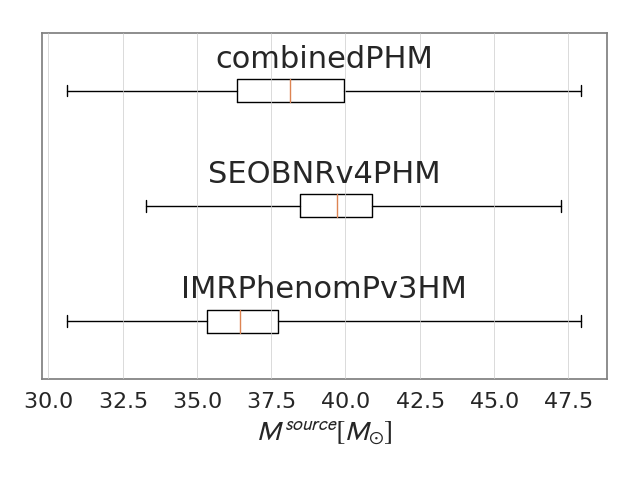
total_mass_source
The figures below show the summary plots for the run
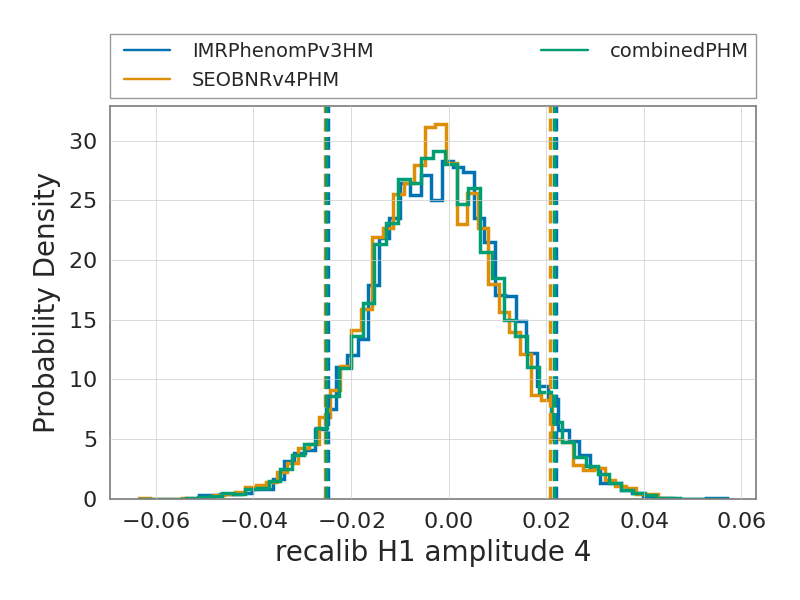
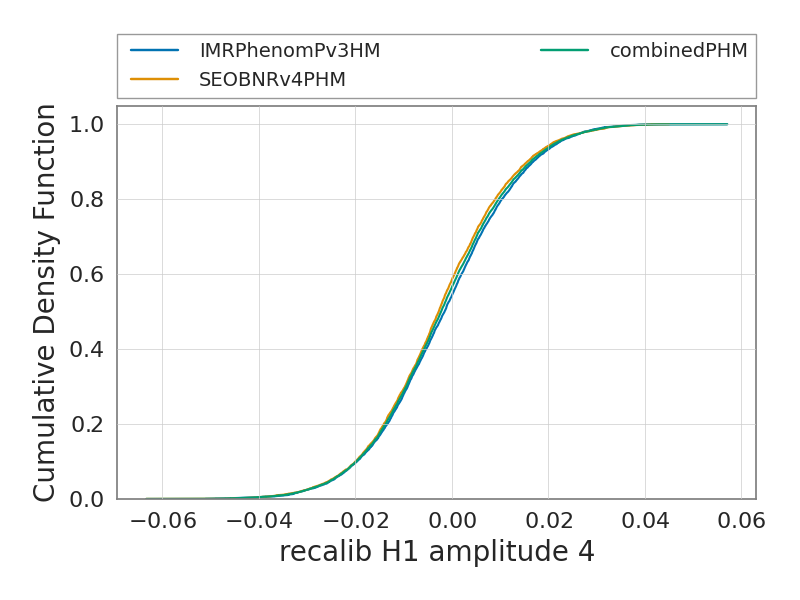
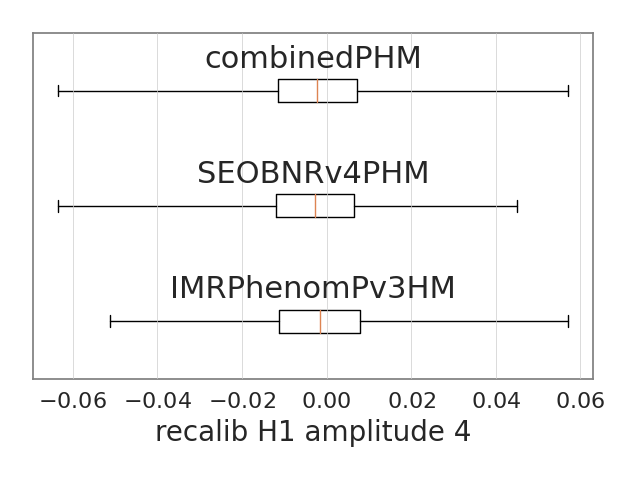
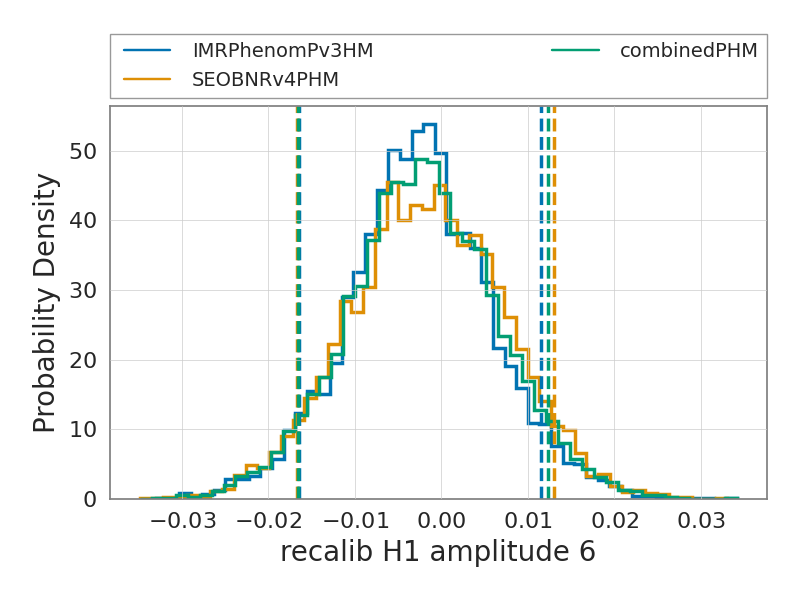
recalib_H1_amplitude_4
The figures below show the summary plots for the run
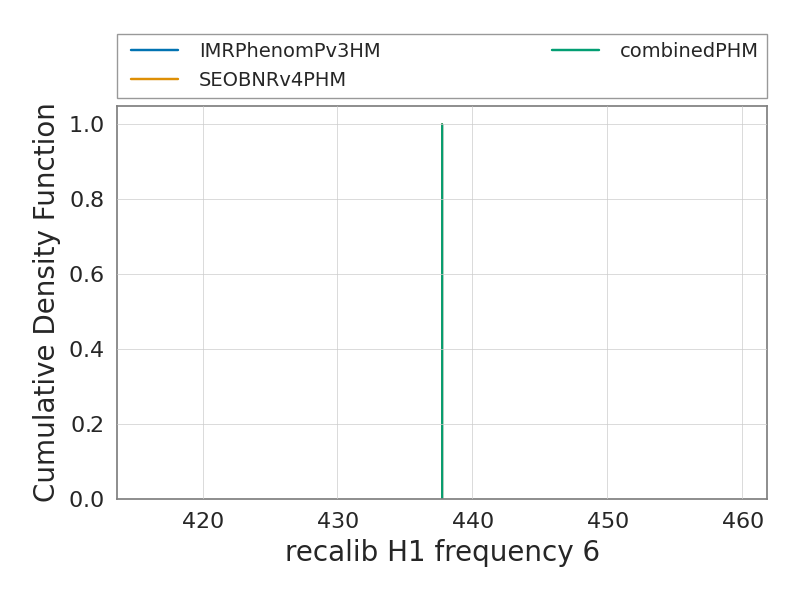
recalib_H1_frequency_6
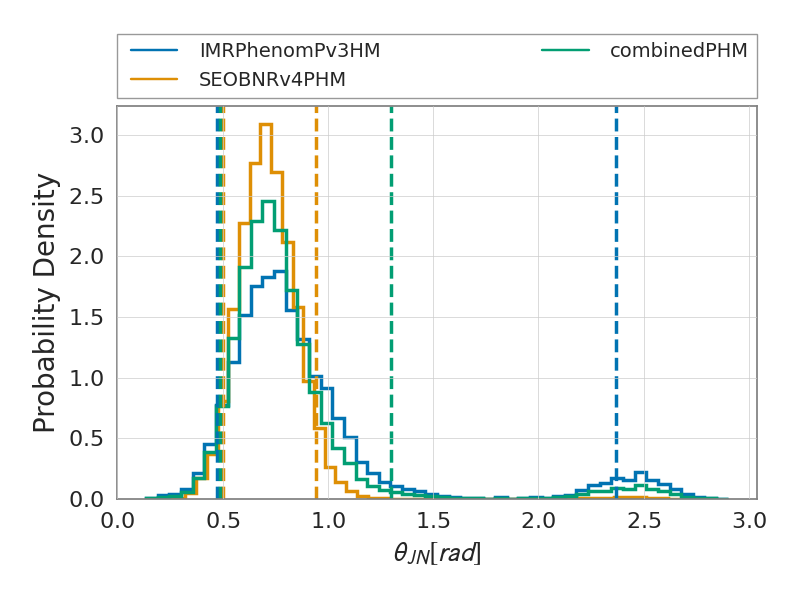
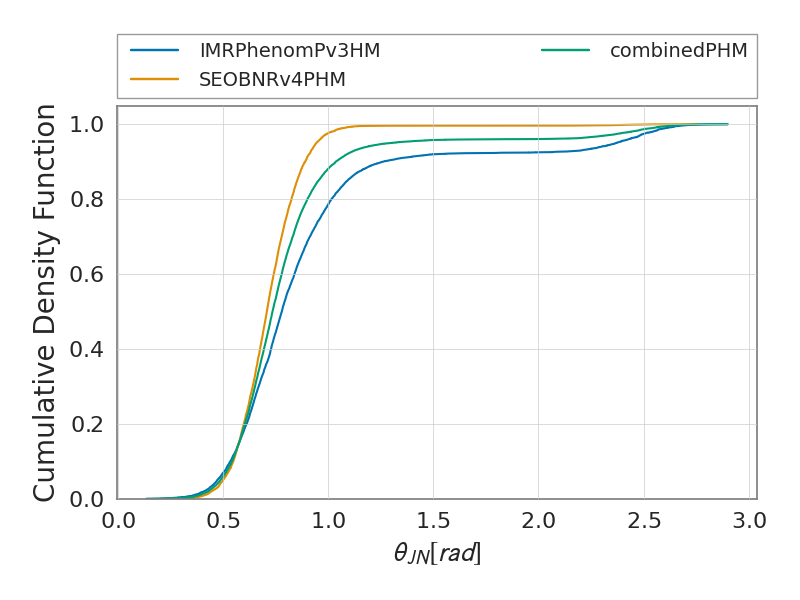
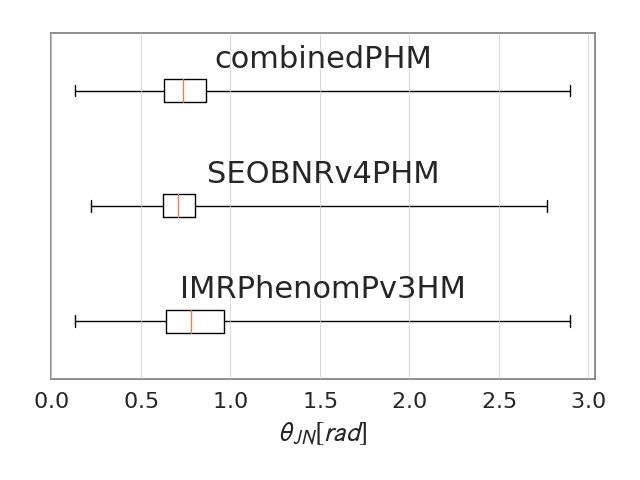
The figures below show the summary plots for the run
theta_jn
The figures below show the summary plots for the run
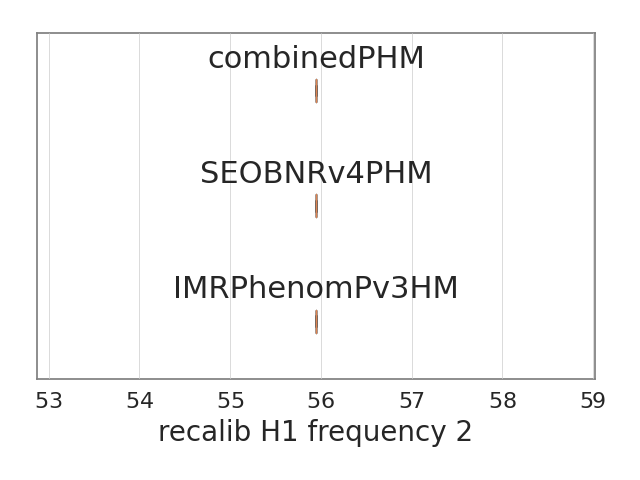
recalib_H1_frequency_2
The figures below show the summary plots for the run
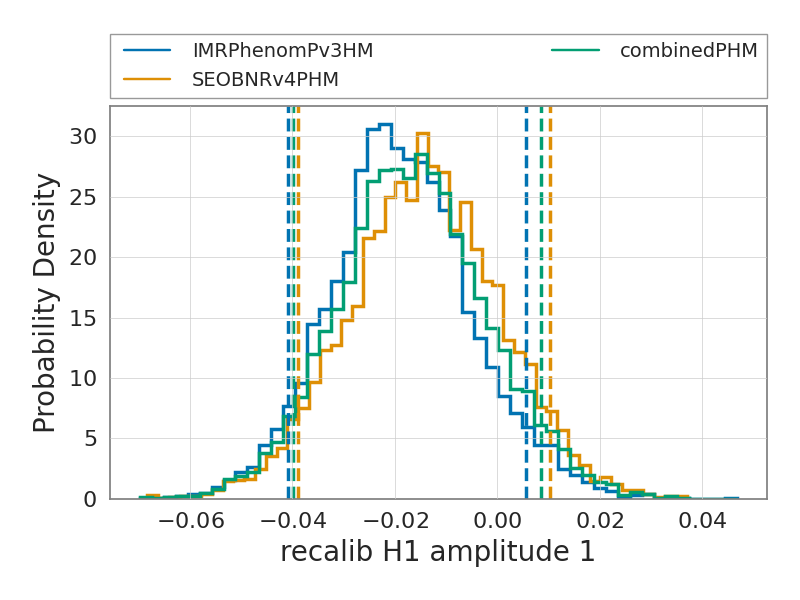
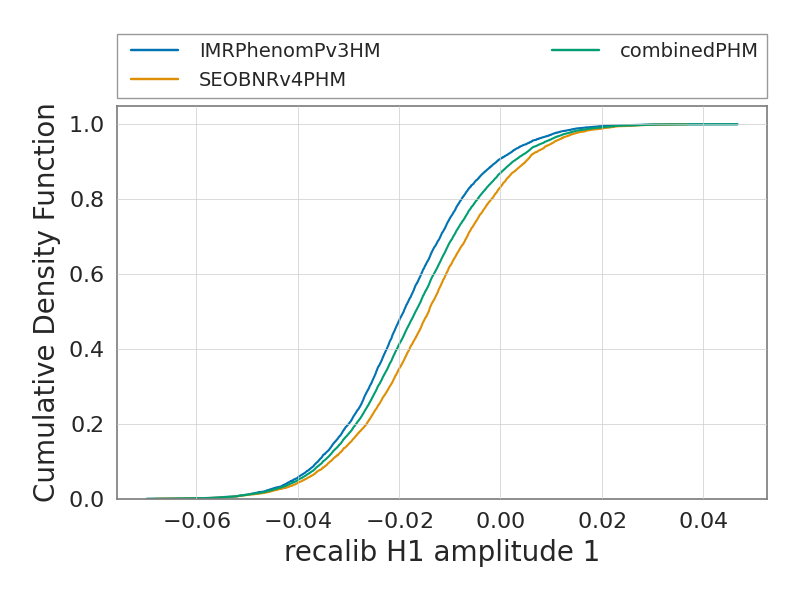
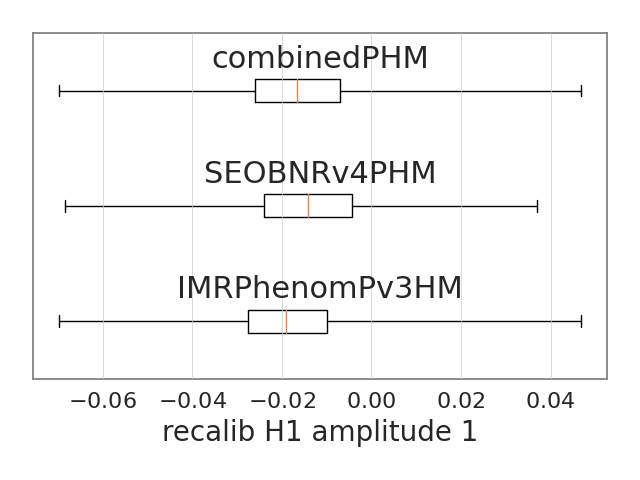
recalib_H1_amplitude_1
The figures below show the summary plots for the run
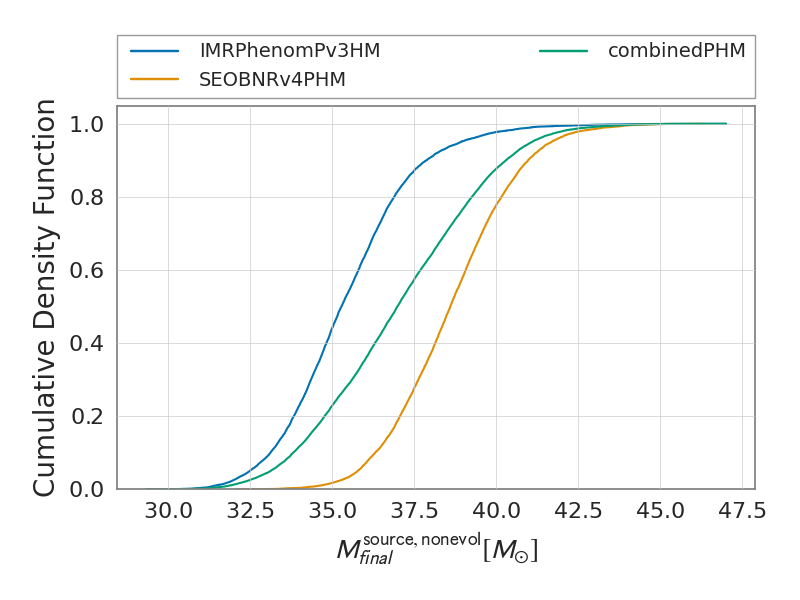
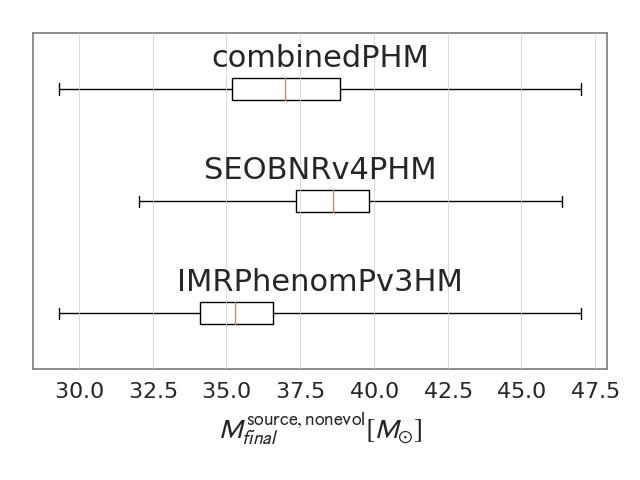
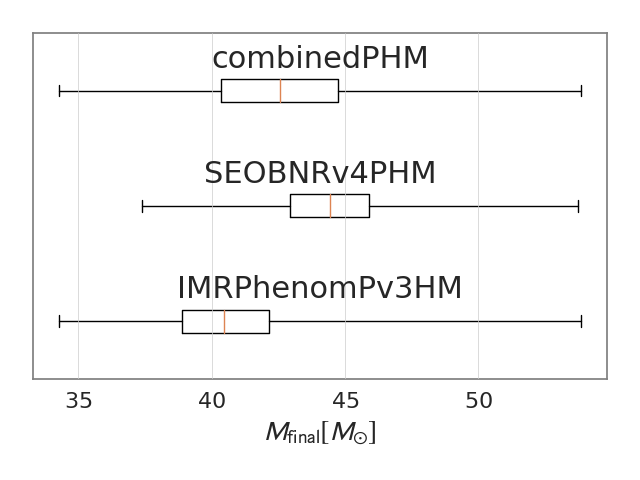
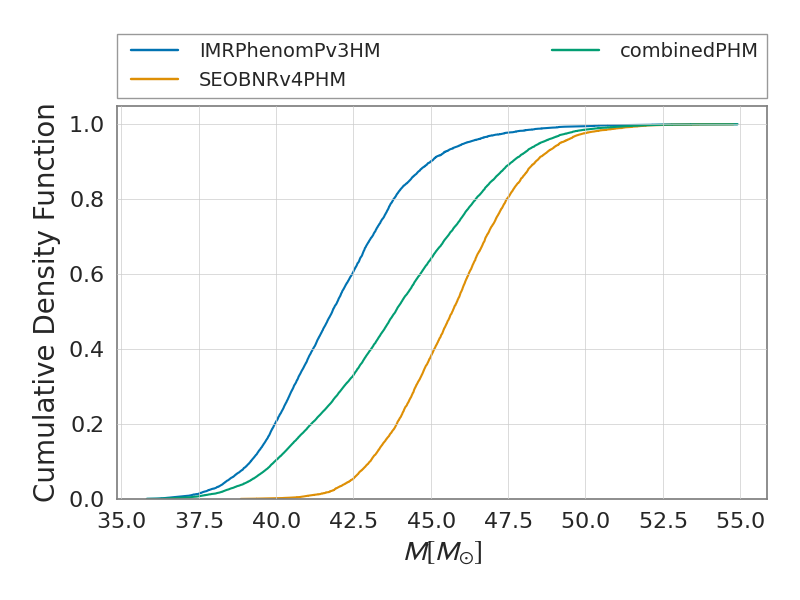
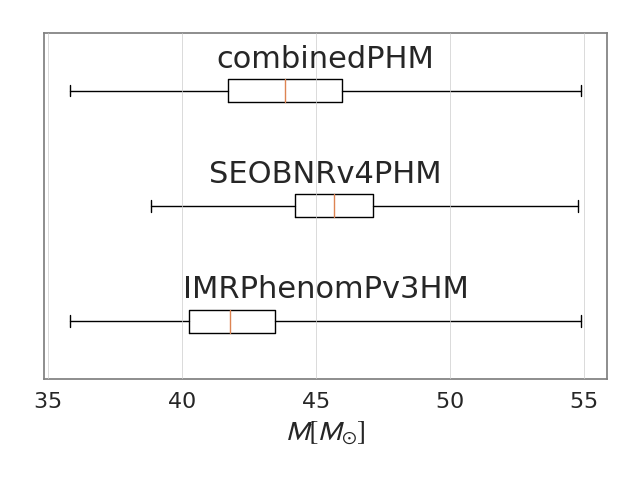
final_mass_source_non_evolved
The figures below show the summary plots for the run
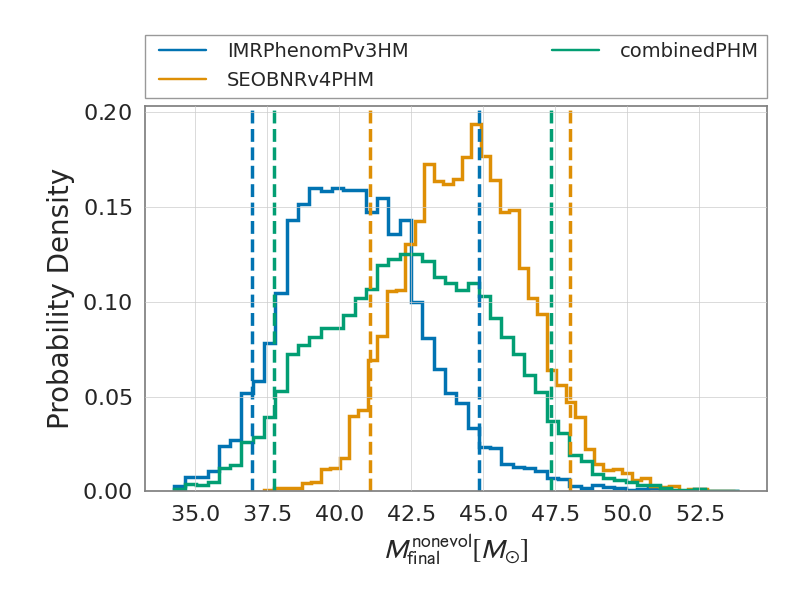
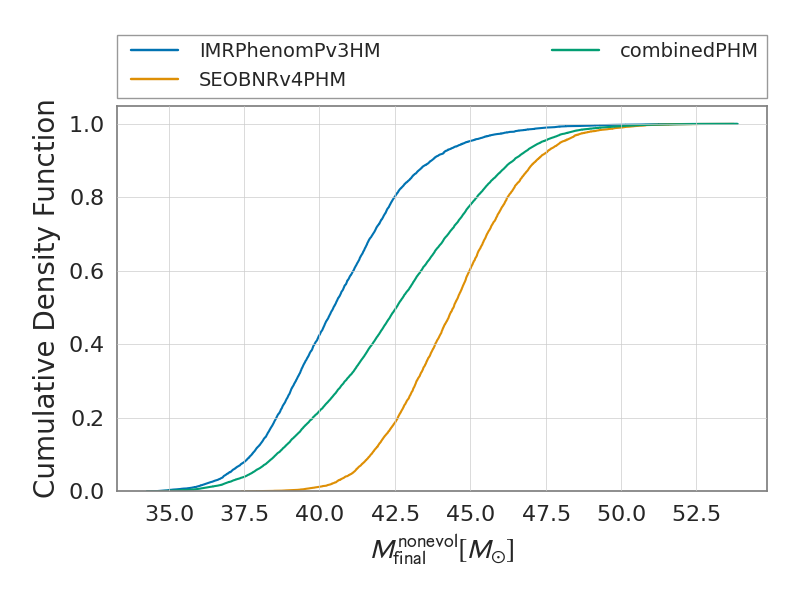
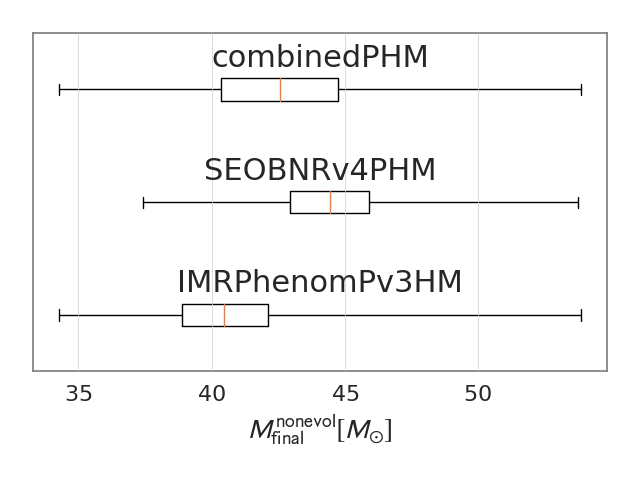
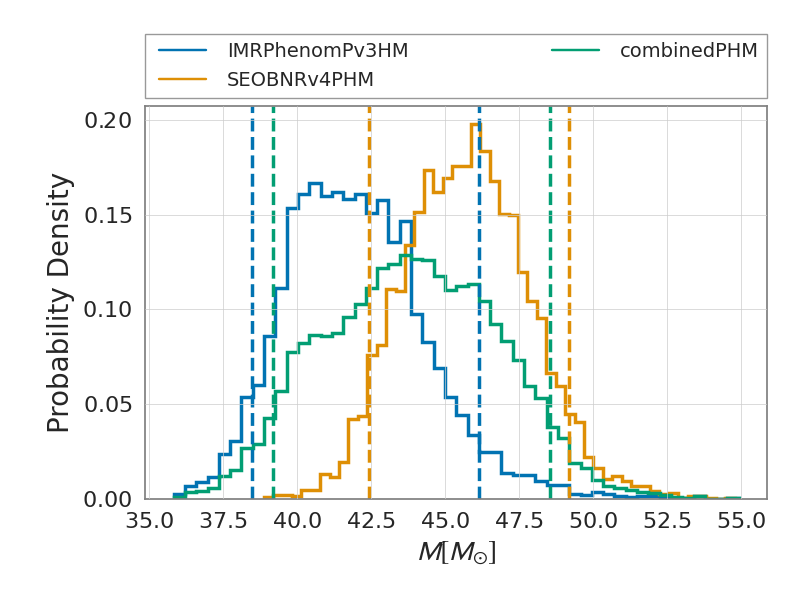
final_mass_non_evolved
The figures below show the summary plots for the run
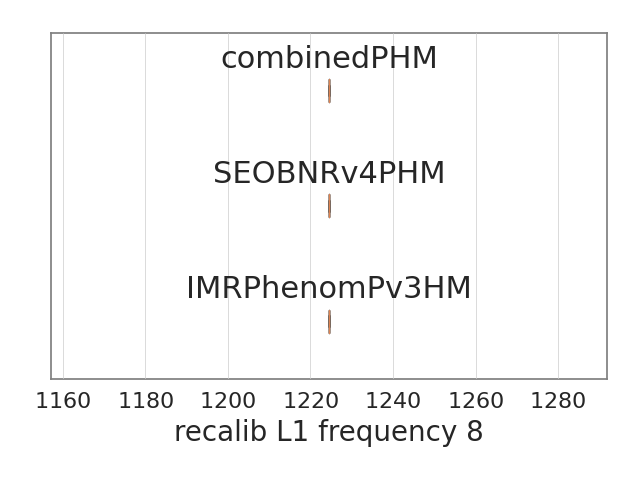
recalib_H1_frequency_8
The figures below show the summary plots for the run
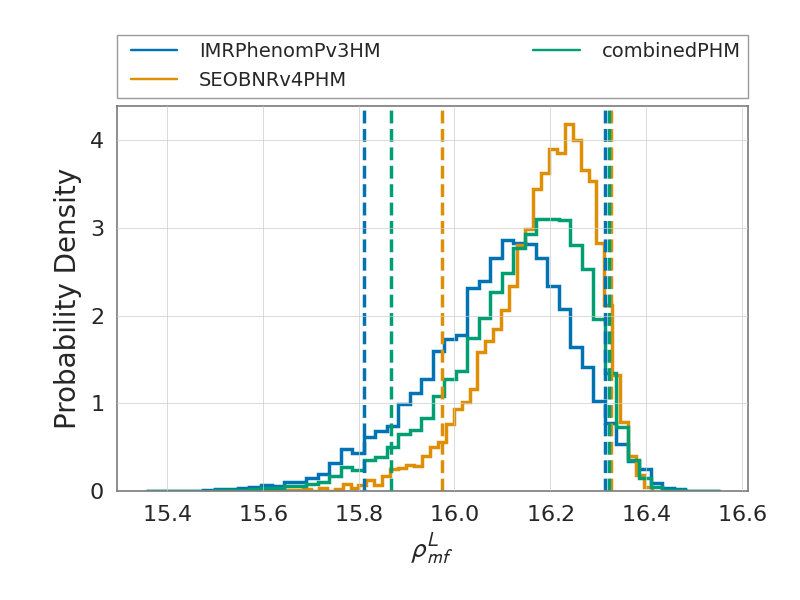
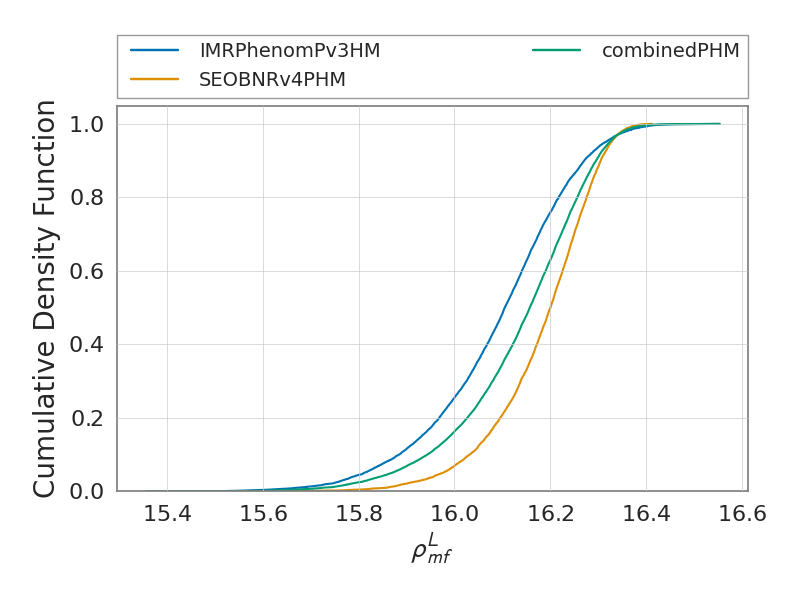
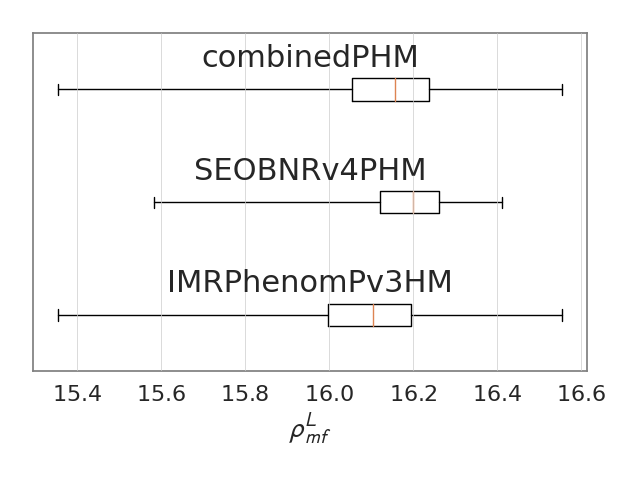
network_matched_filter_snr
The figures below show the summary plots for the run
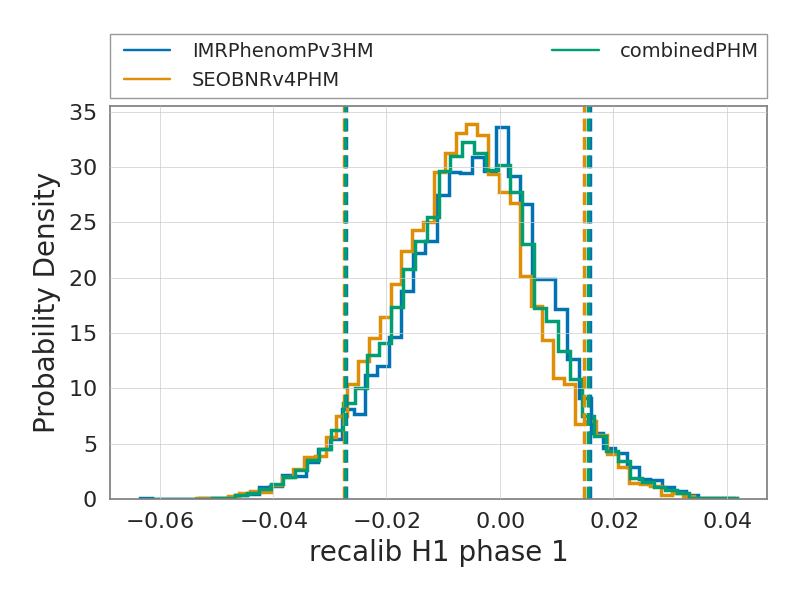
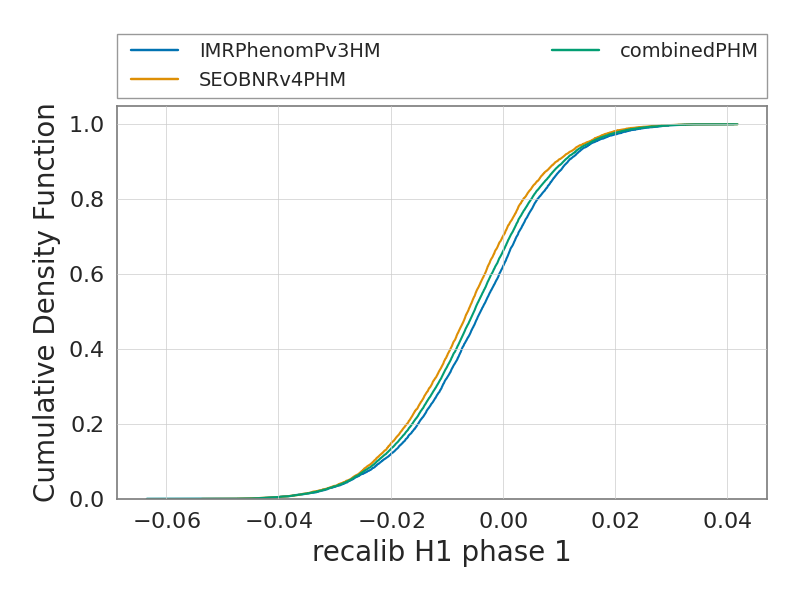
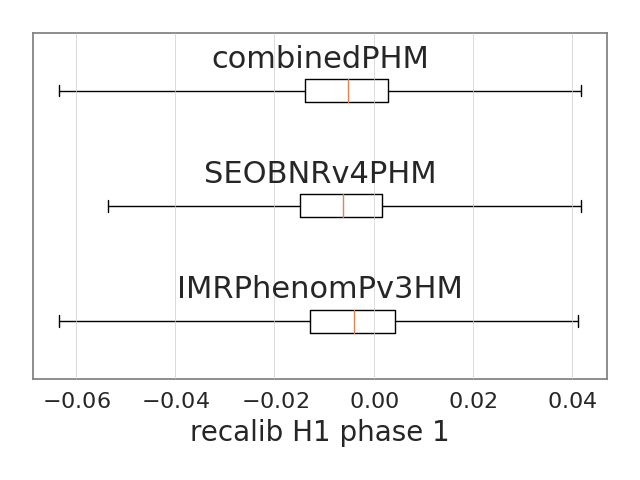
recalib_H1_phase_1
The figures below show the summary plots for the run
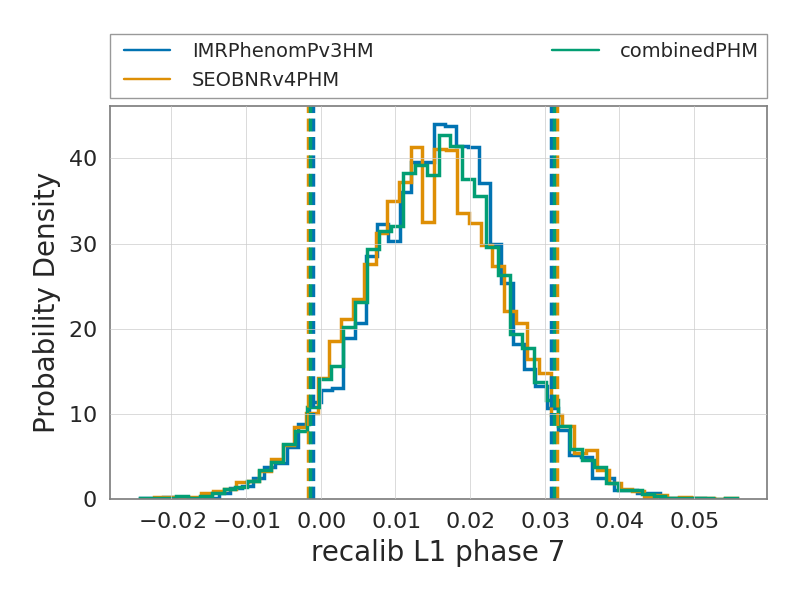
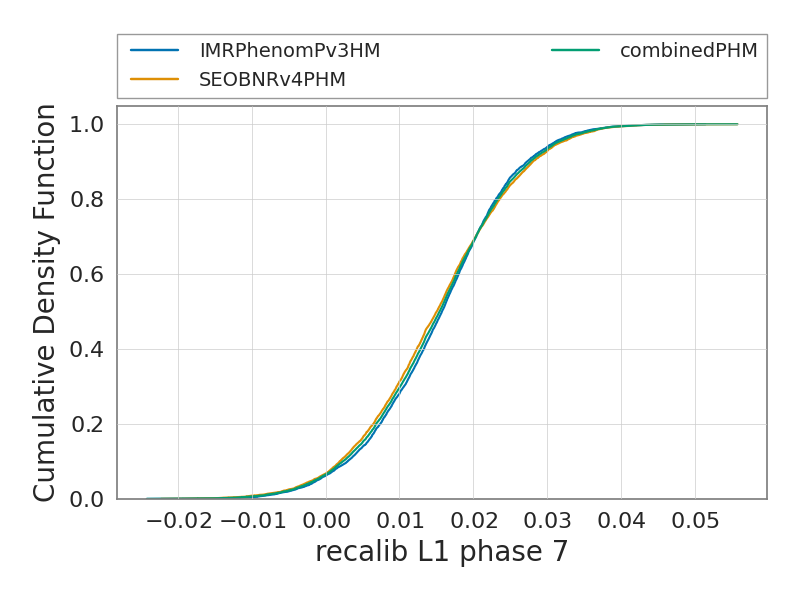
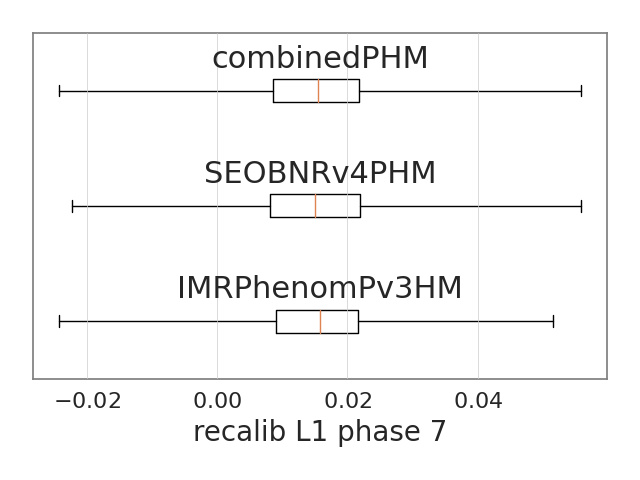
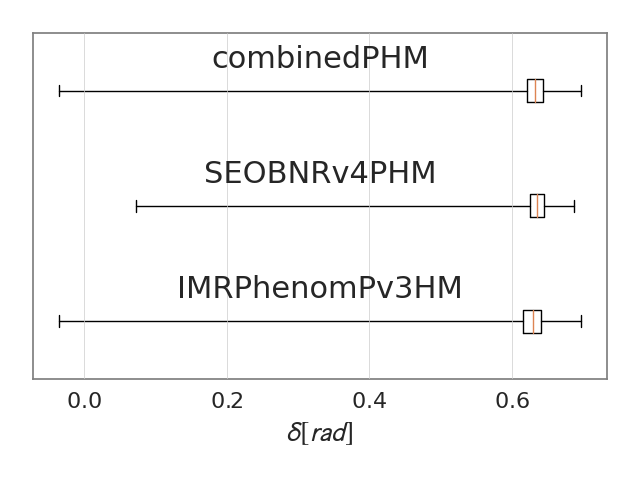
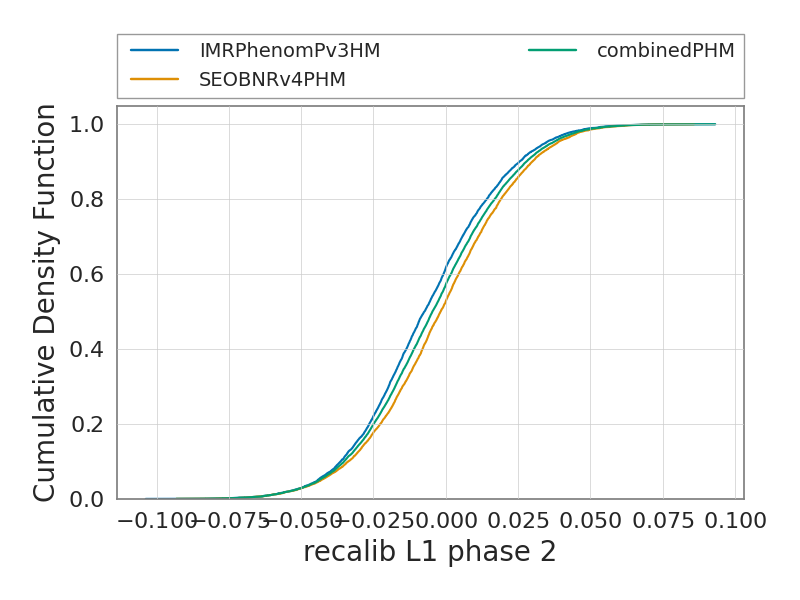
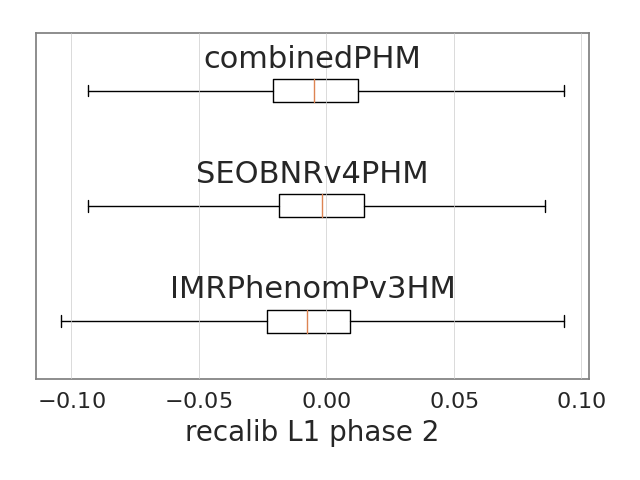
recalib_L1_phase_7
The figures below show the summary plots for the run
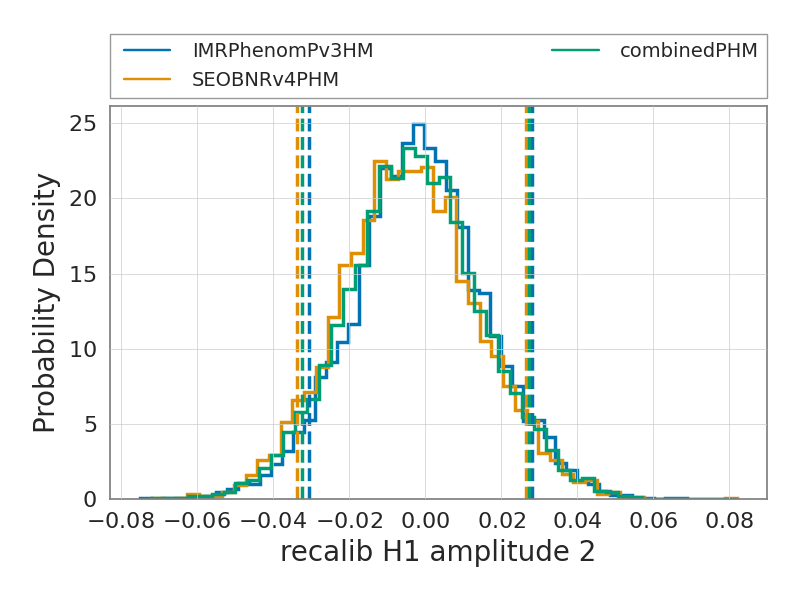
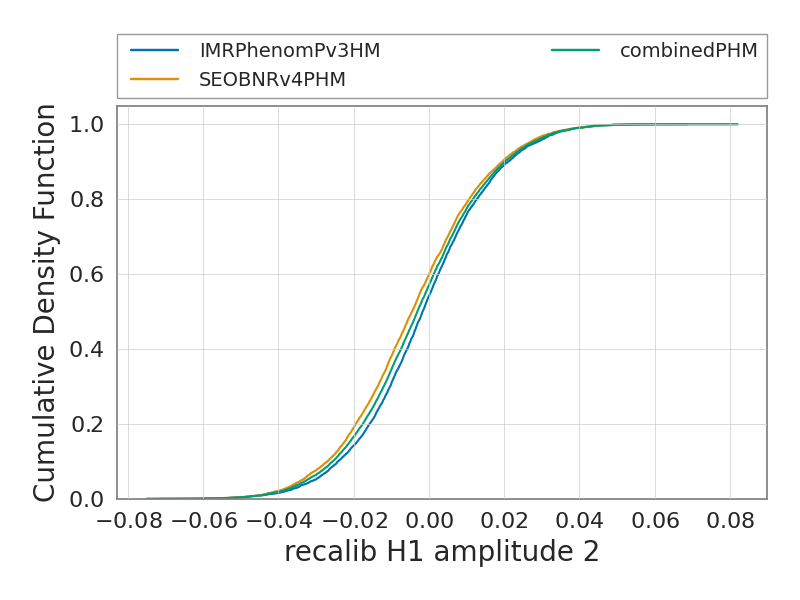
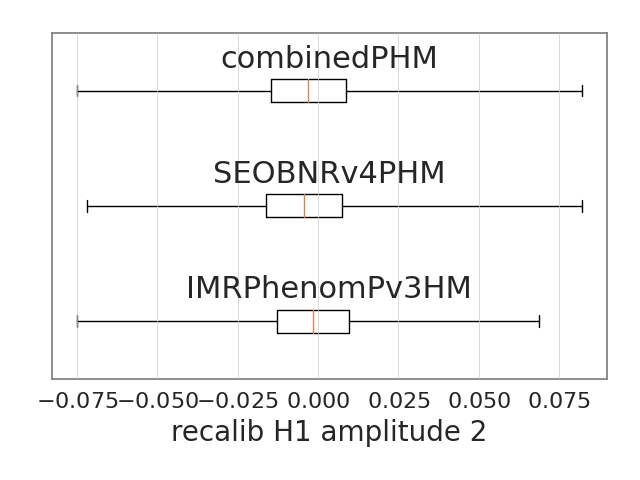
recalib_H1_amplitude_2
The figures below show the summary plots for the run
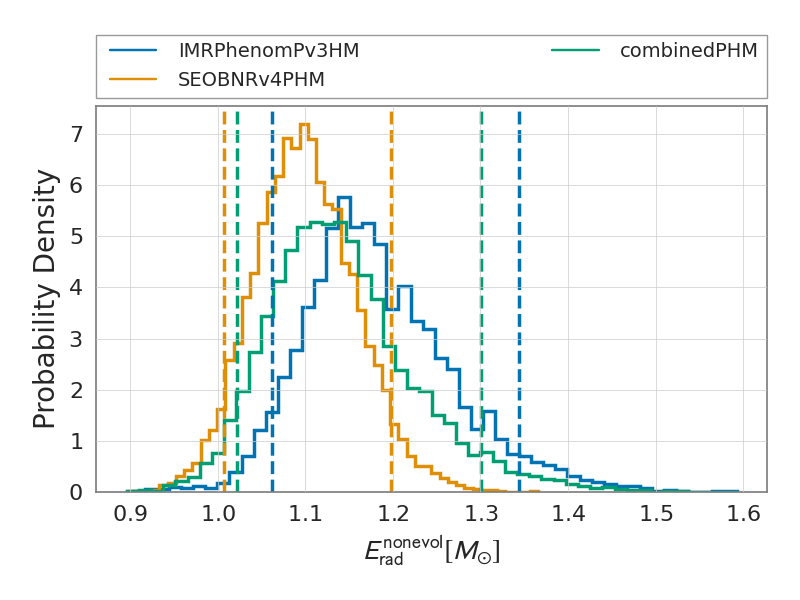
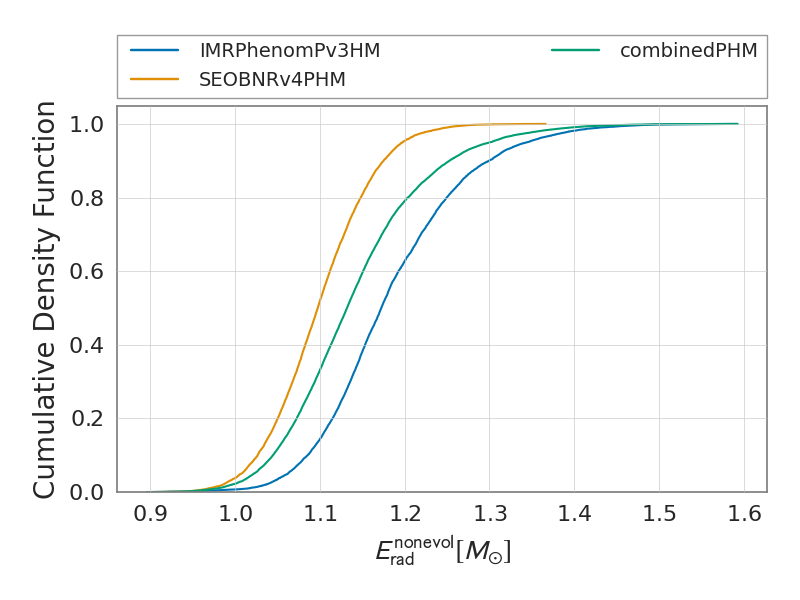
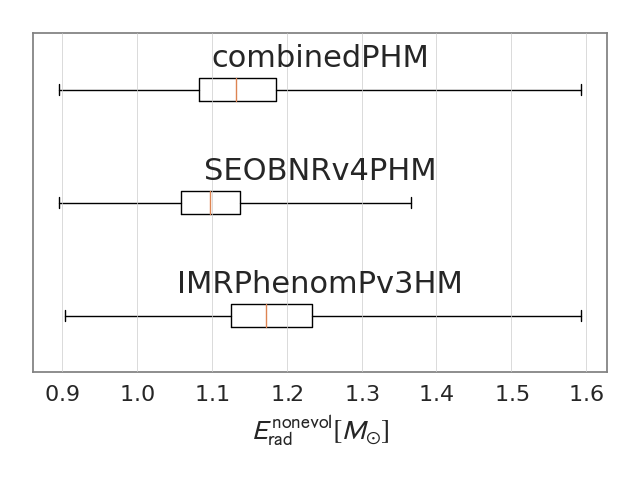
radiated_energy_non_evolved
The figures below show the summary plots for the run
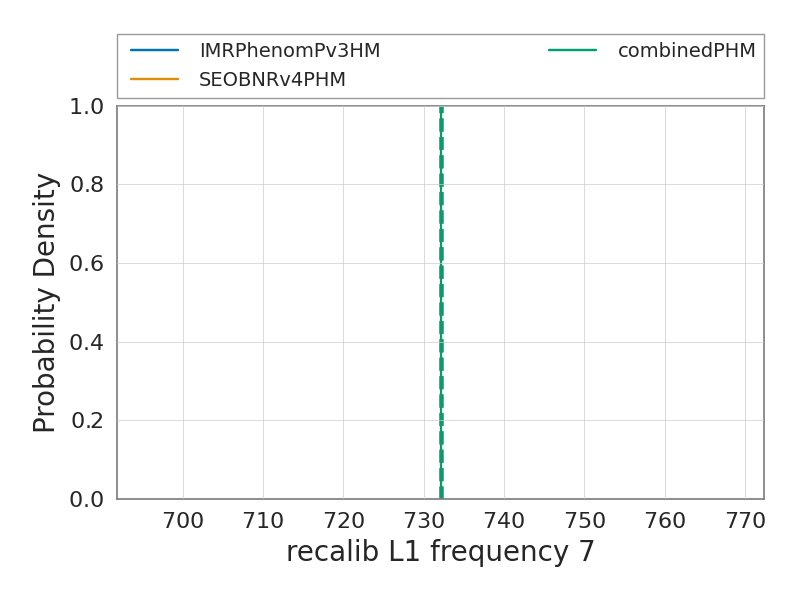
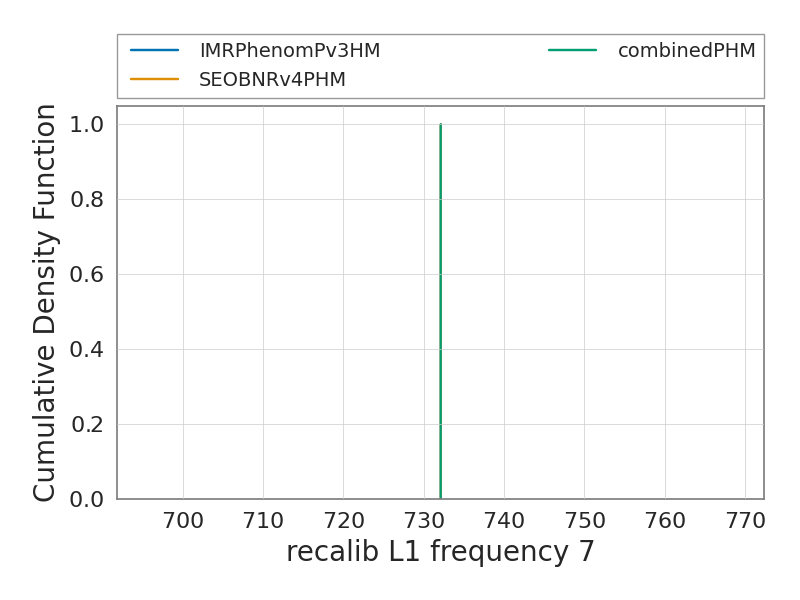
recalib_V1_frequency_7
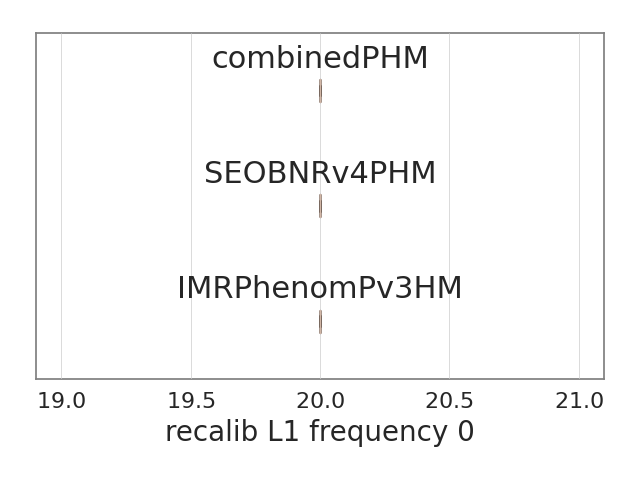
The figures below show the summary plots for the run
recalib_L1_frequency_0
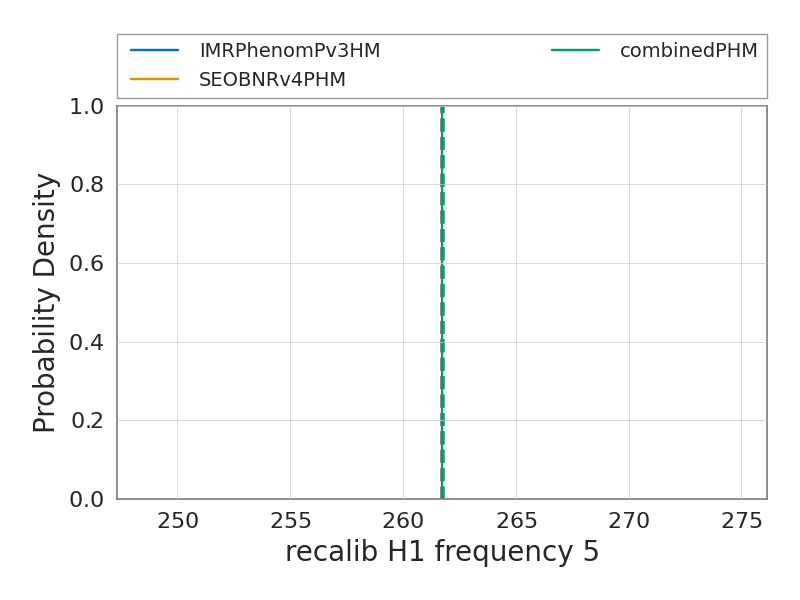
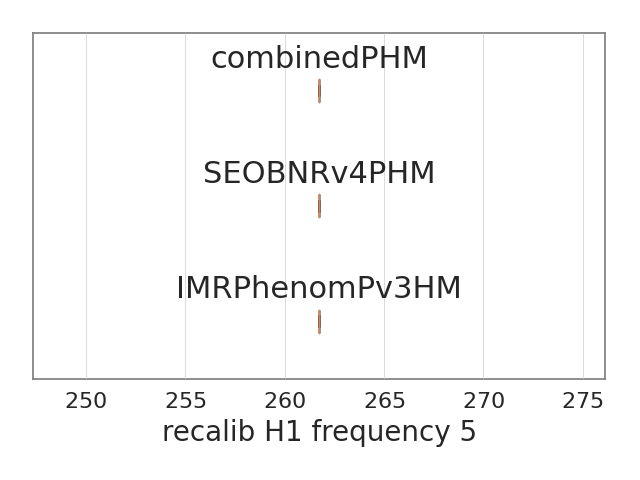
The figures below show the summary plots for the run
recalib_H1_frequency_5
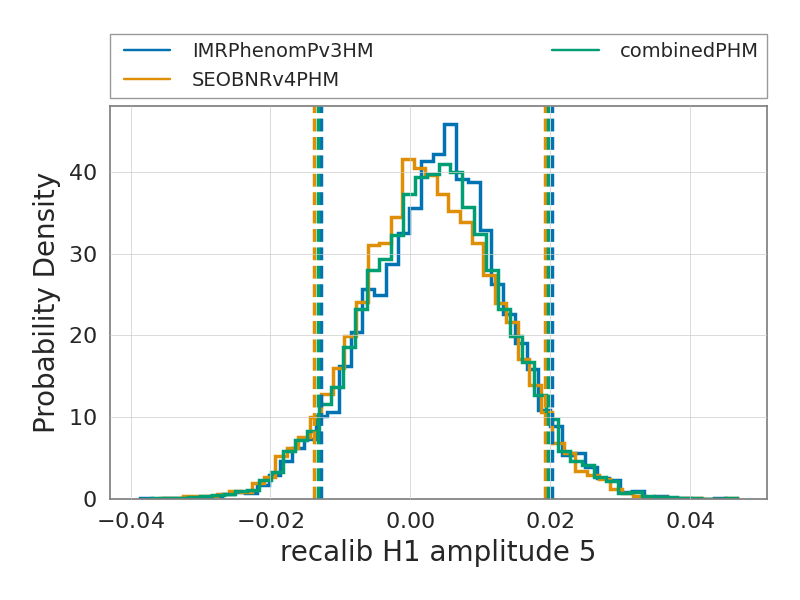
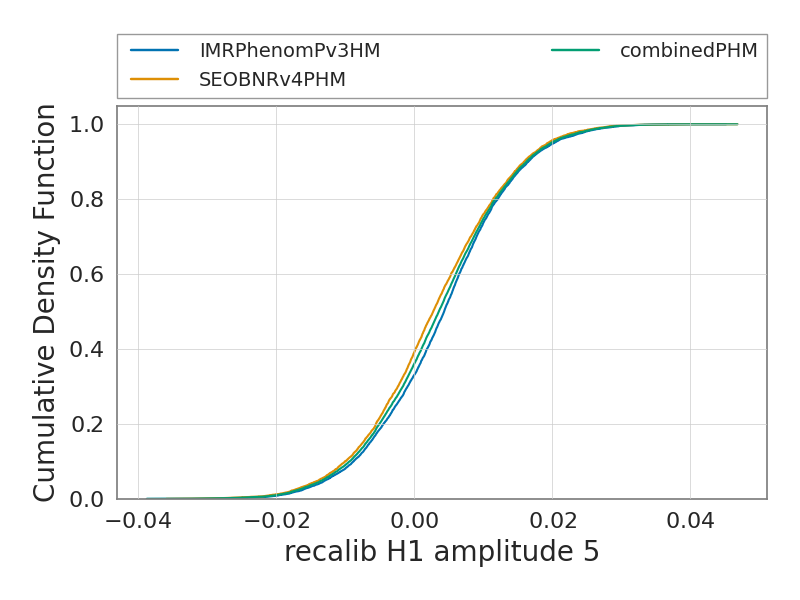
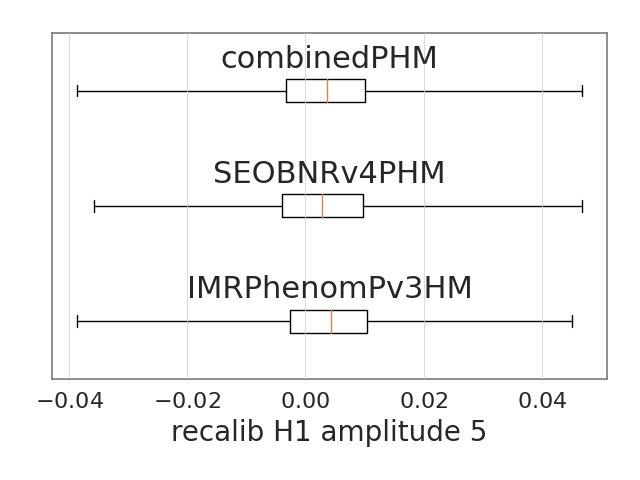
The figures below show the summary plots for the run
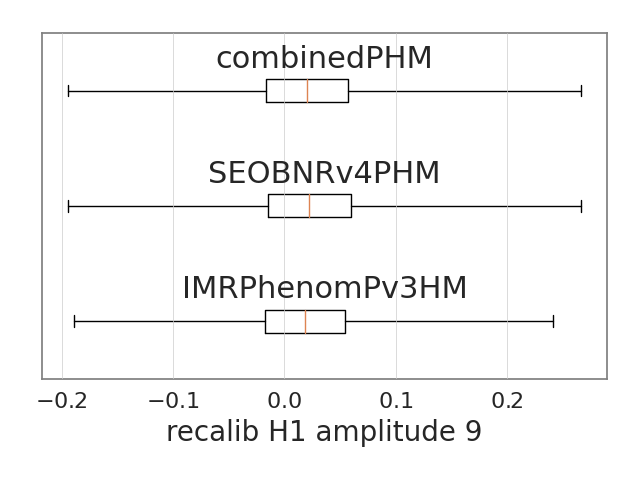
recalib_H1_amplitude_5
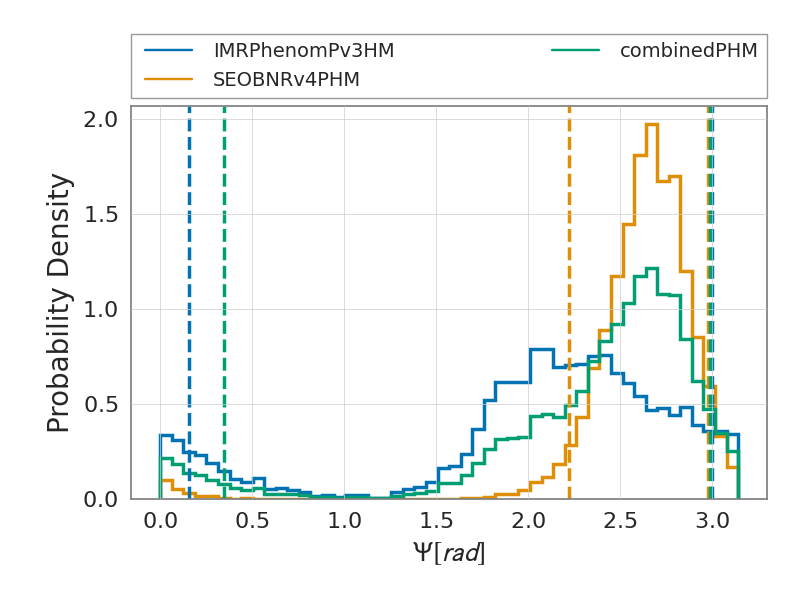
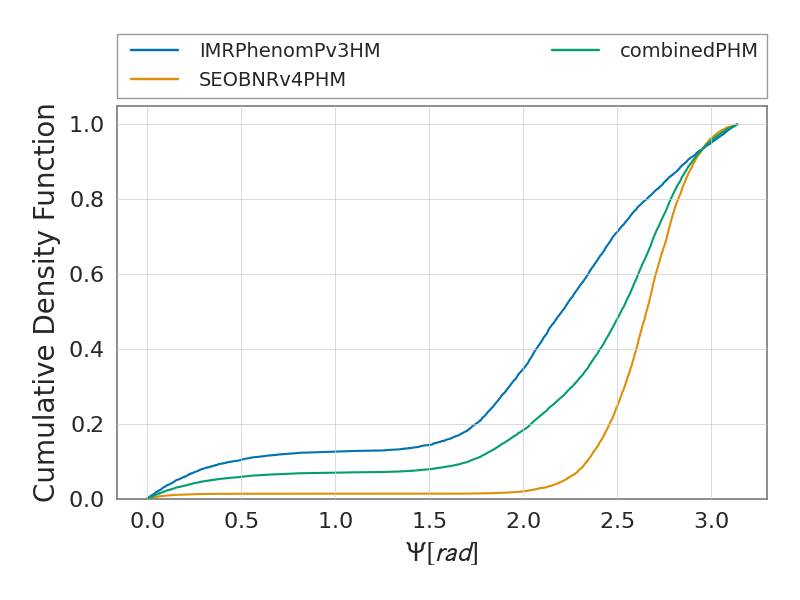
The figures below show the summary plots for the run
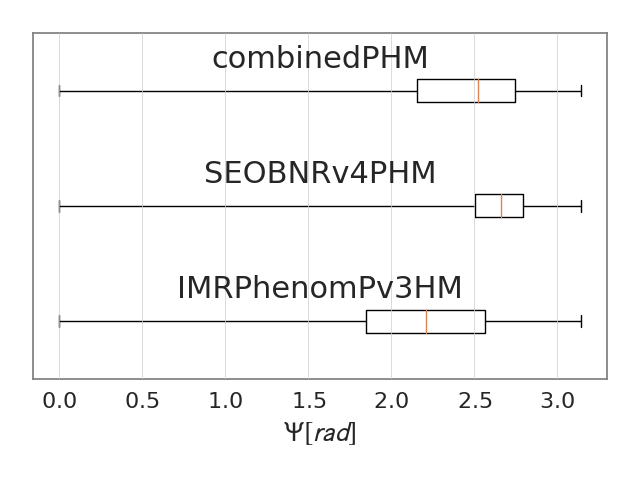
psi
The figures below show the summary plots for the run
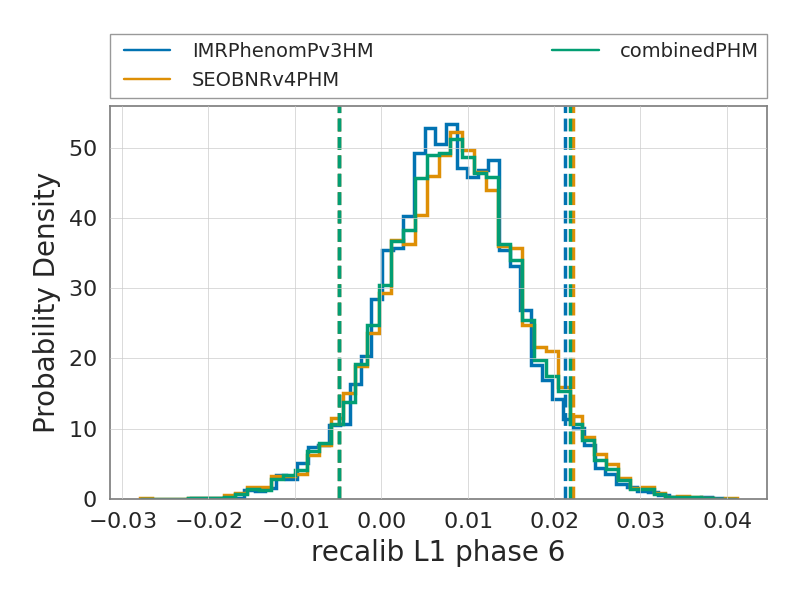
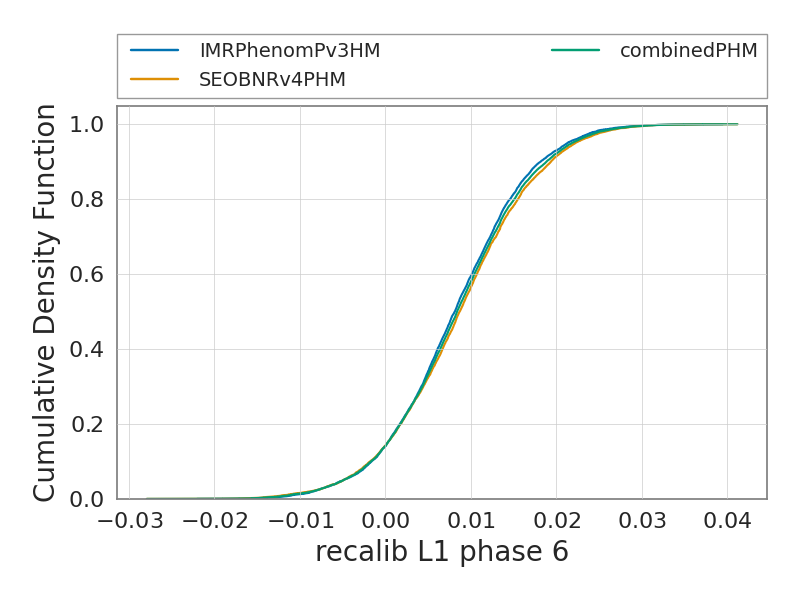
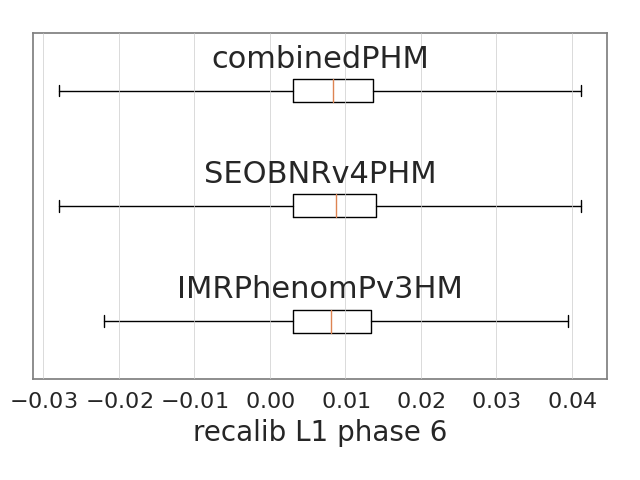
recalib_L1_phase_6
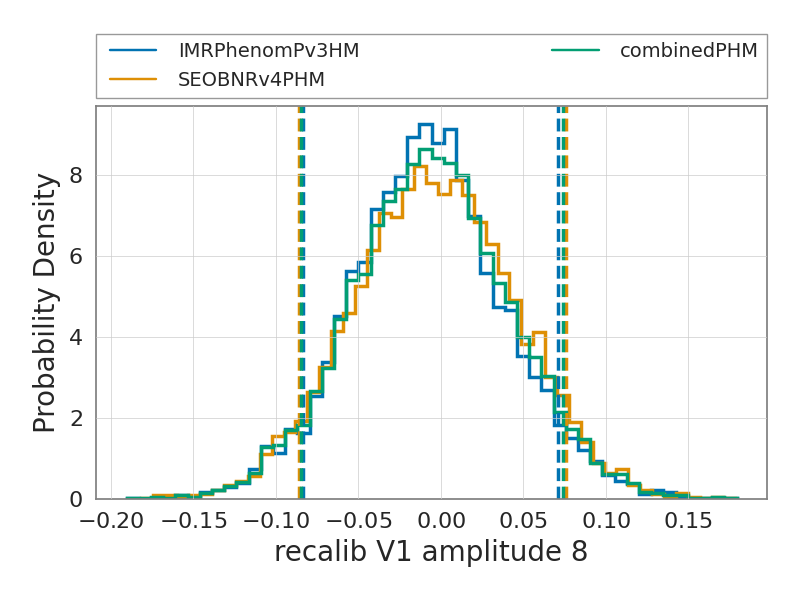
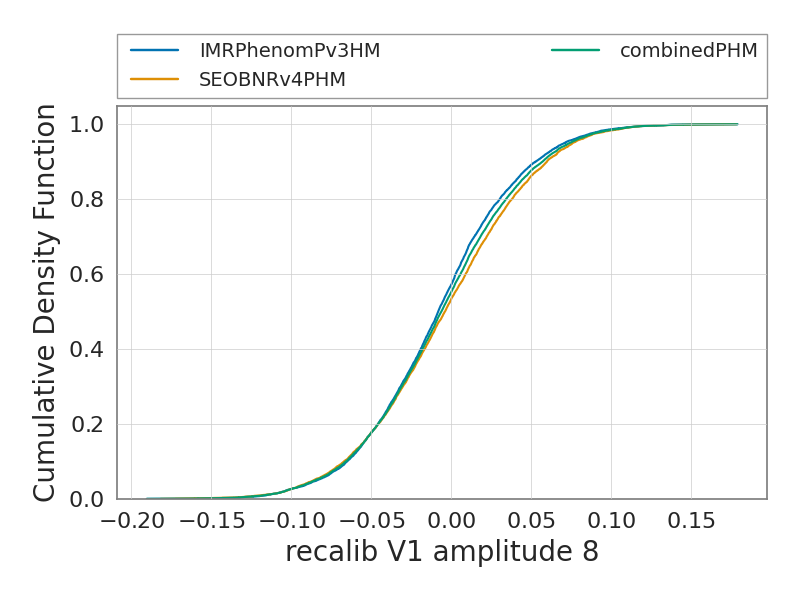
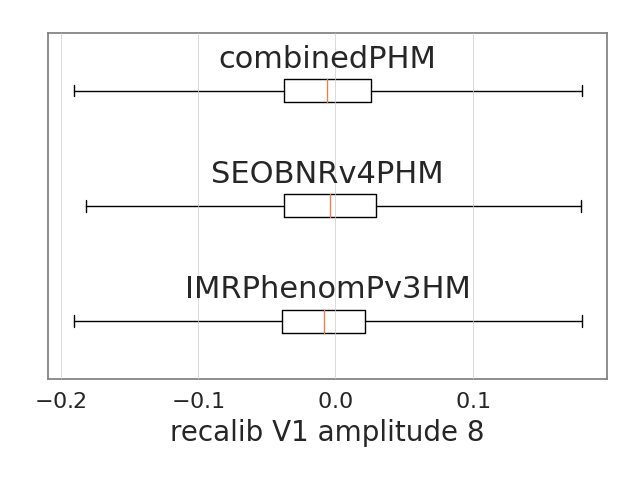
The figures below show the summary plots for the run
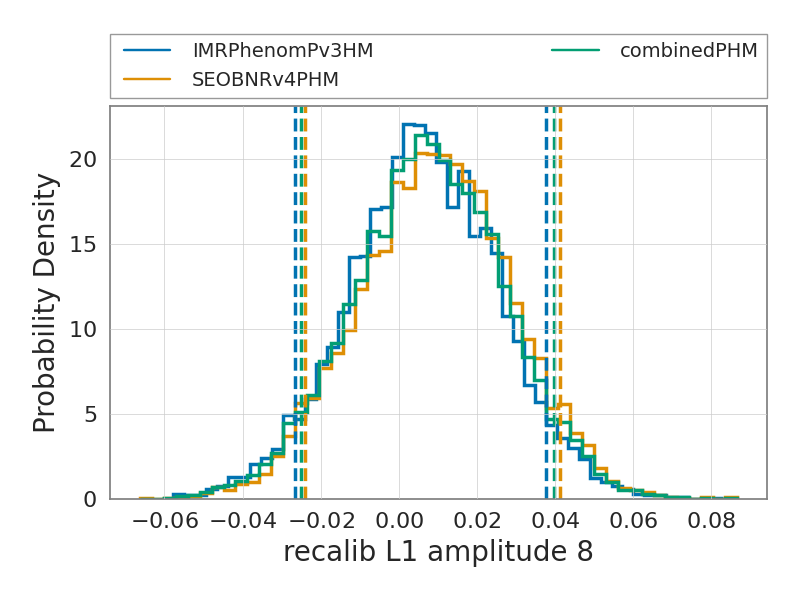
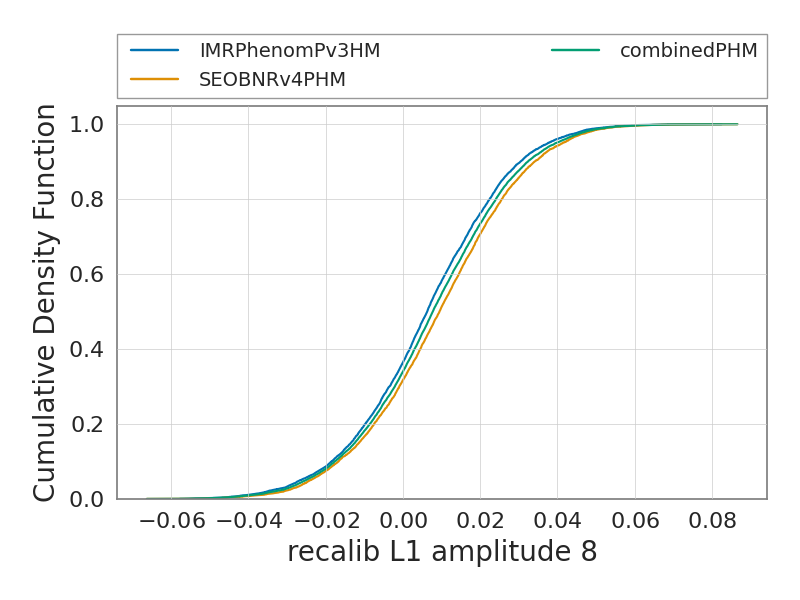
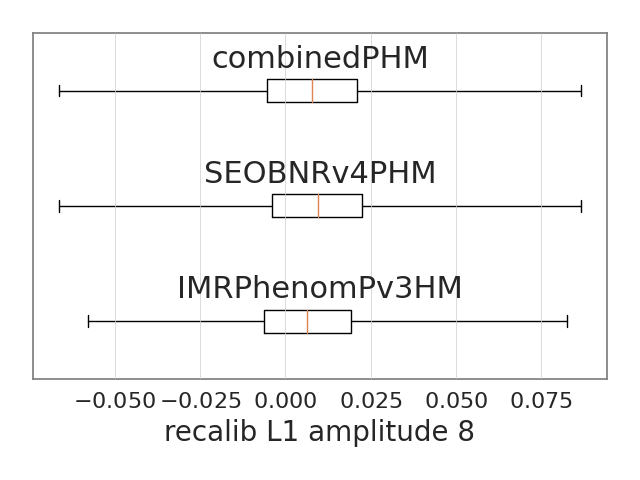
recalib_V1_amplitude_8
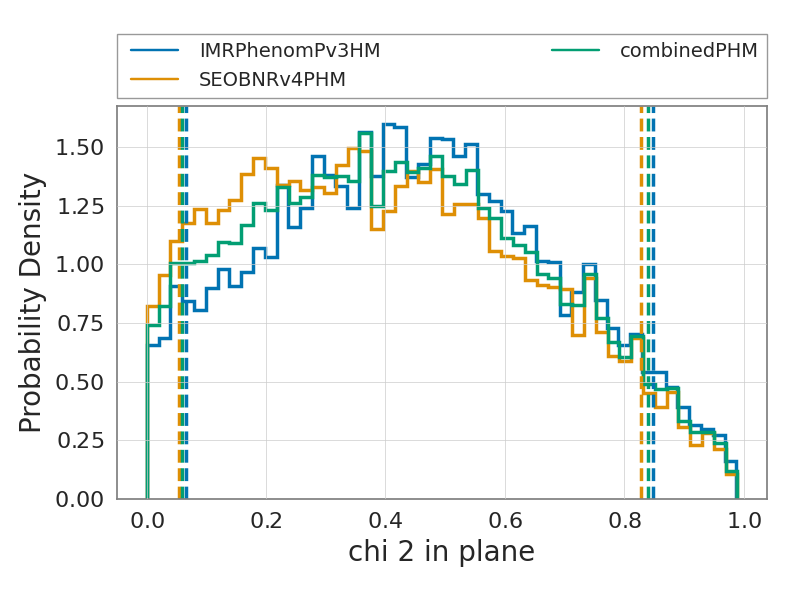
The figures below show the summary plots for the run
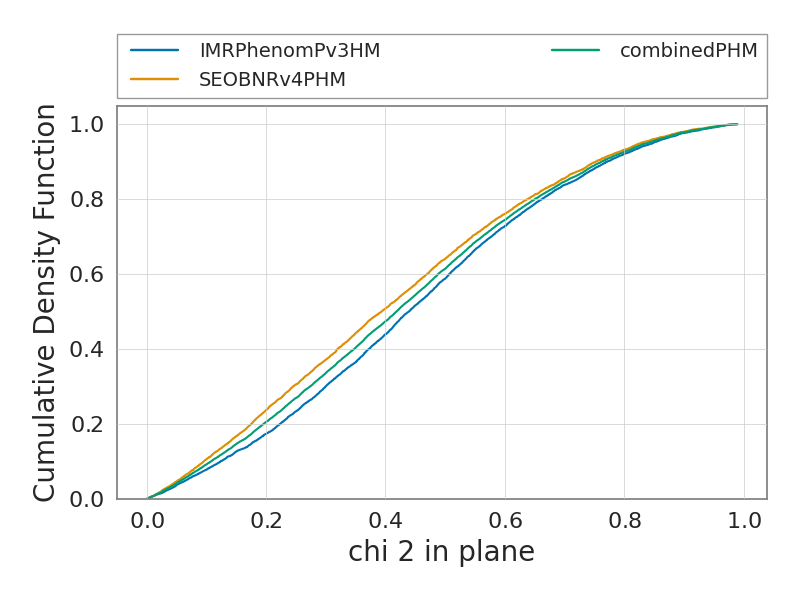
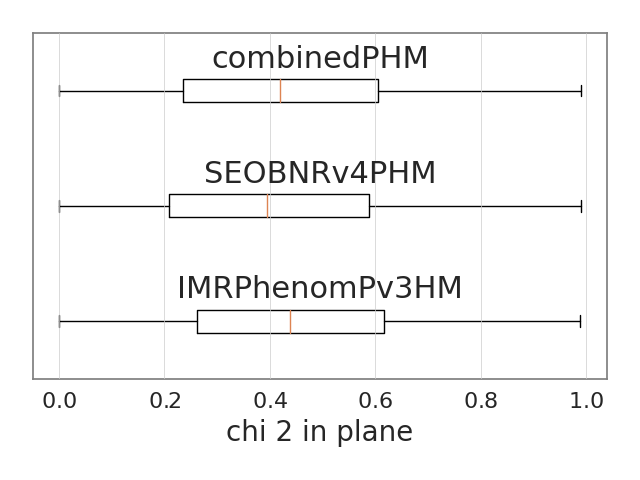
chi_2_in_plane
The figures below show the summary plots for the run
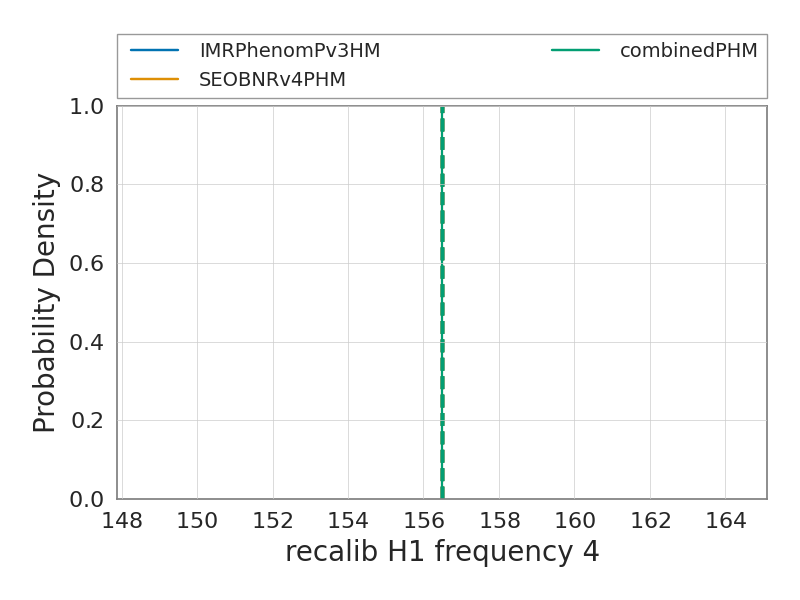
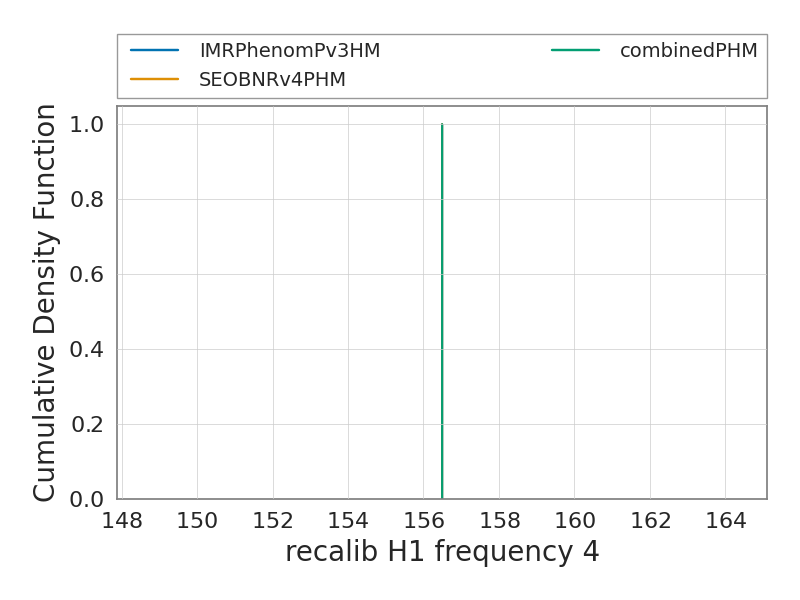
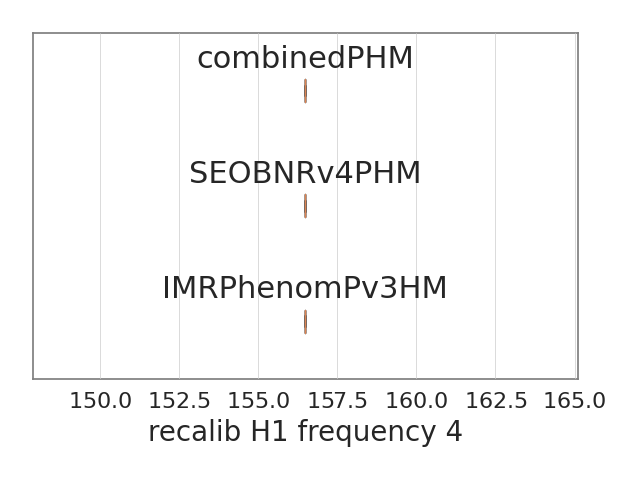
recalib_H1_frequency_4
The figures below show the summary plots for the run
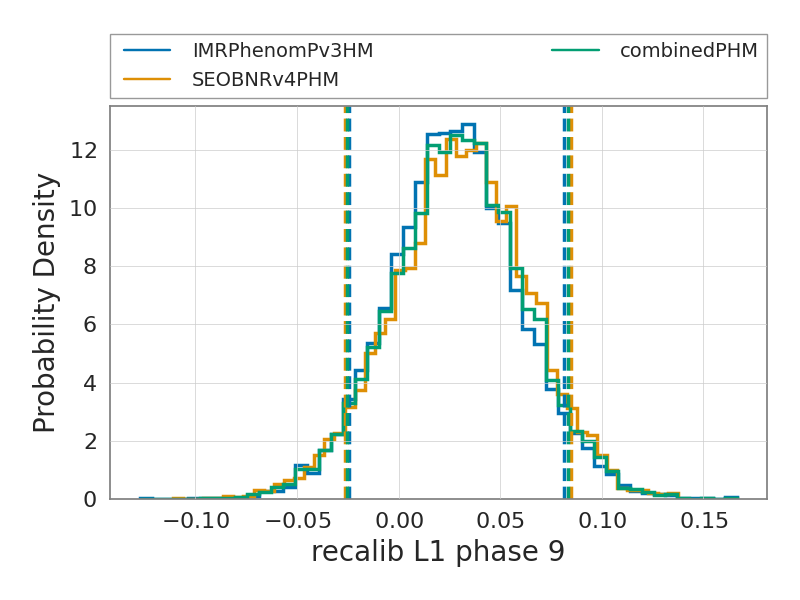
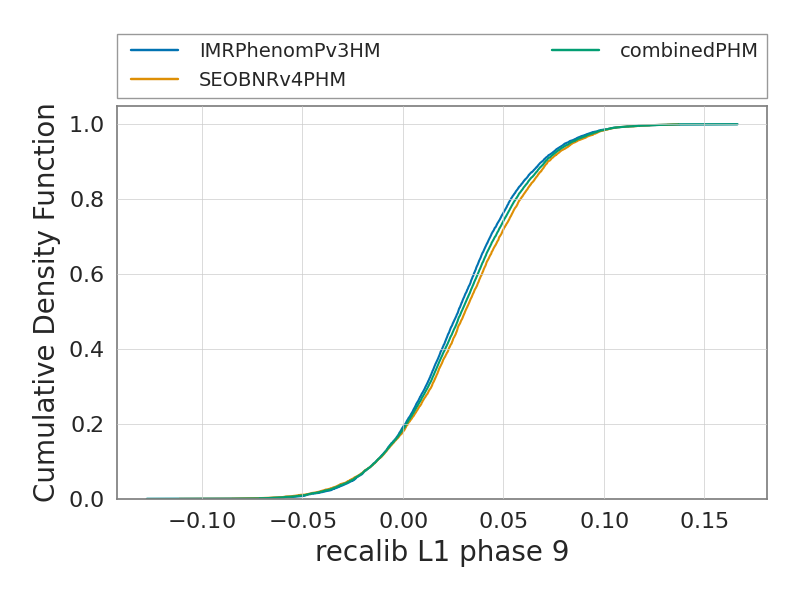
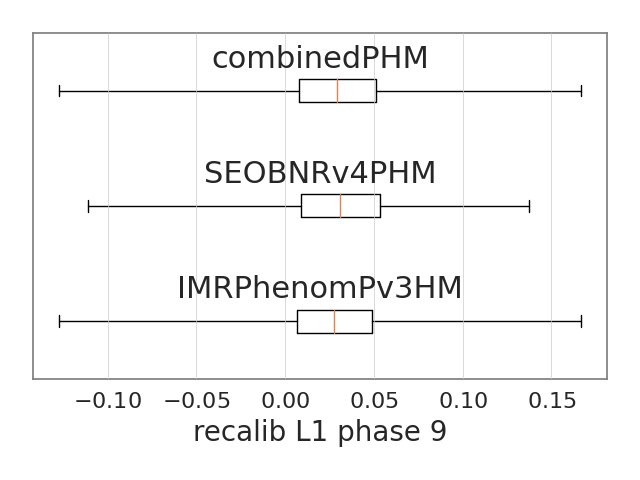
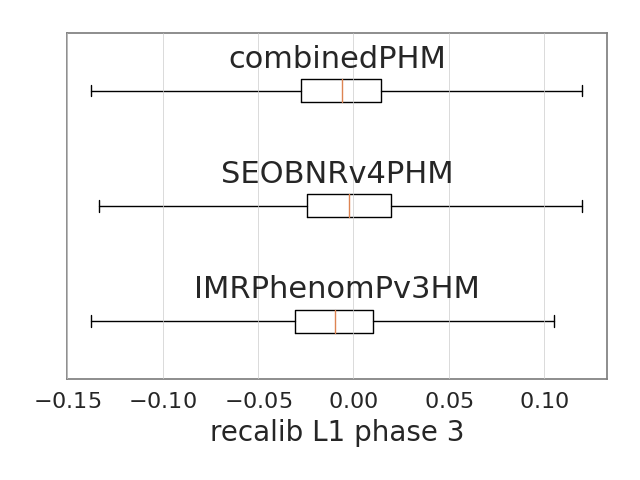
recalib_L1_phase_9
The figures below show the summary plots for the run
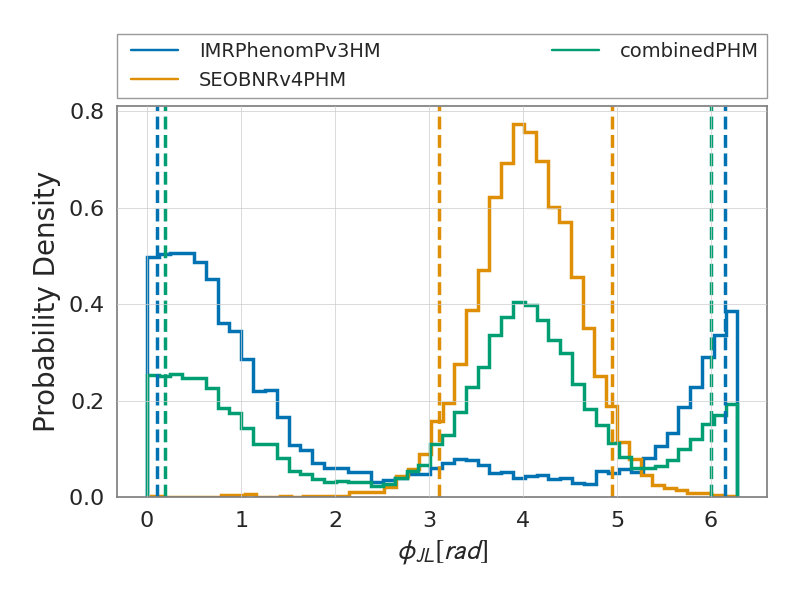
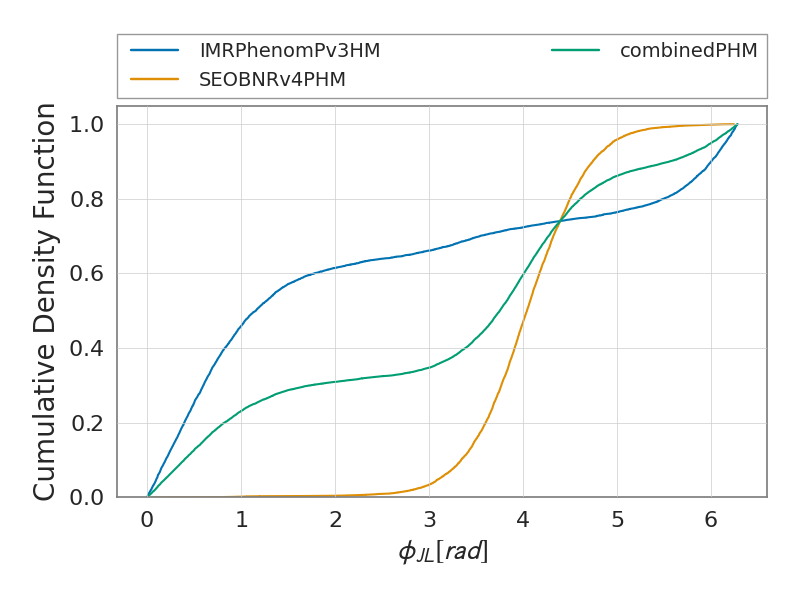
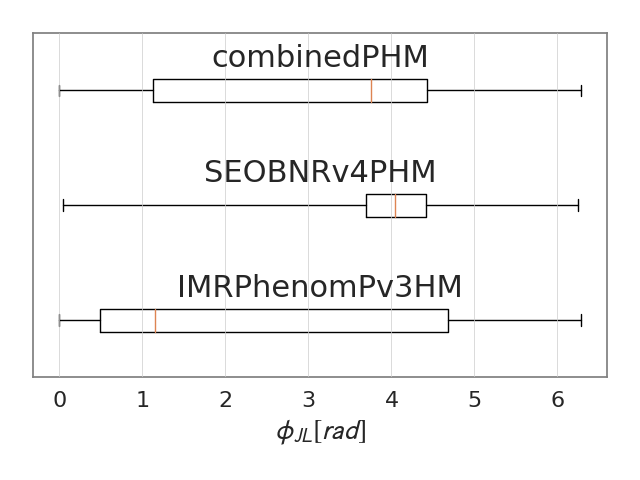
phi_jl
The figures below show the summary plots for the run
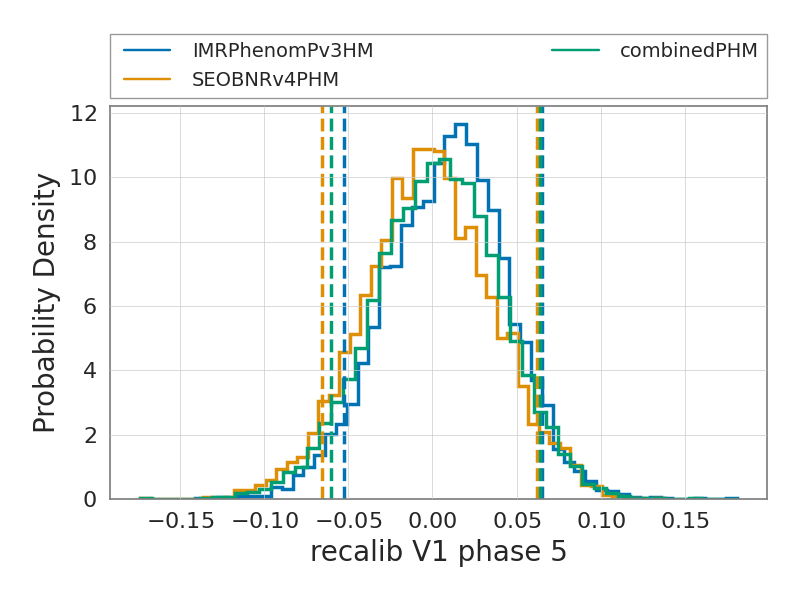
recalib_V1_phase_5
The figures below show the summary plots for the run
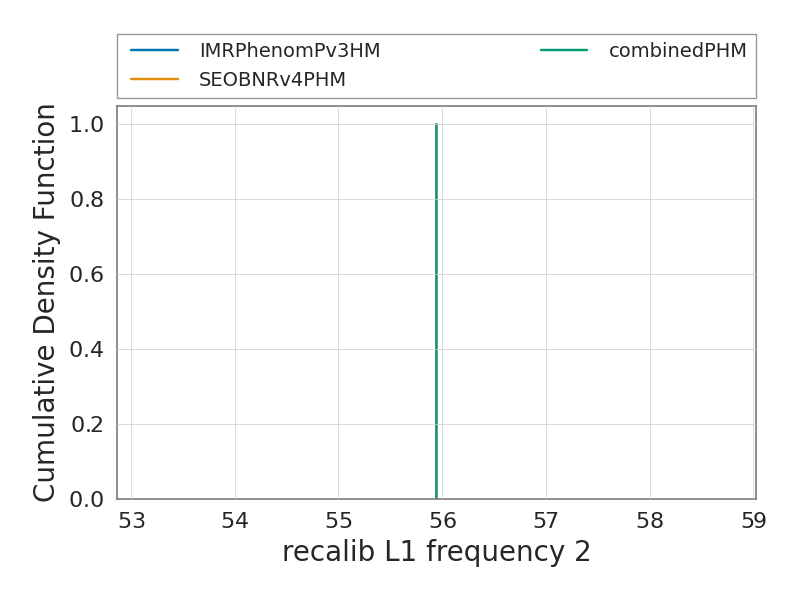
recalib_L1_frequency_2
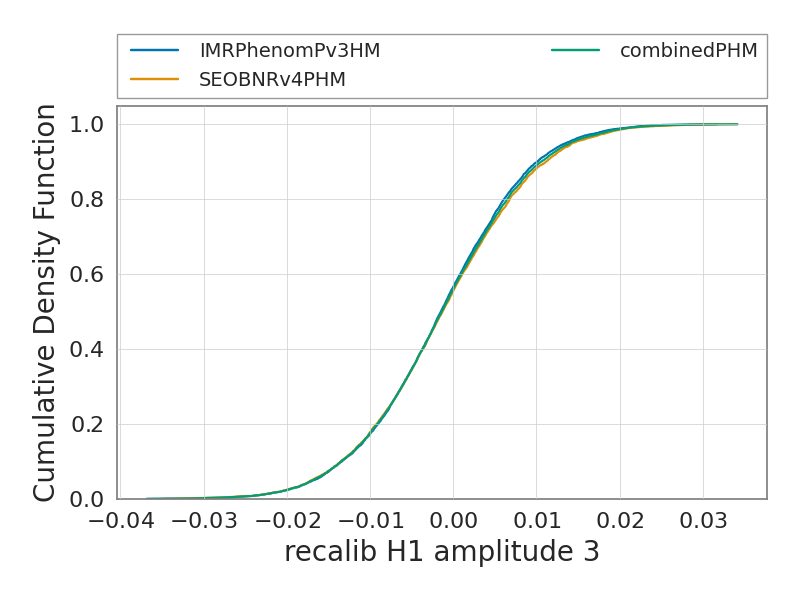
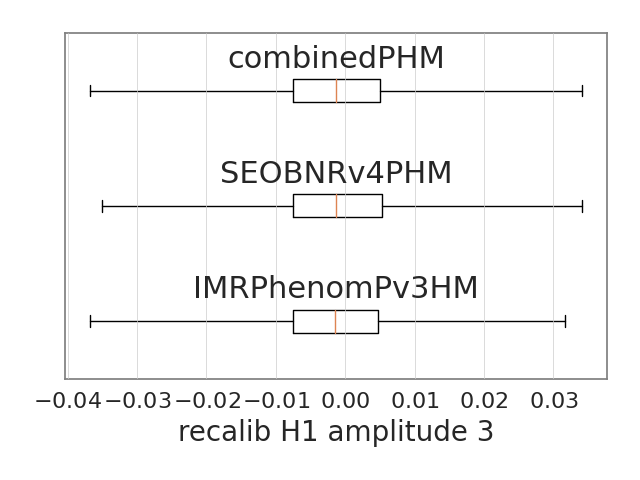
The figures below show the summary plots for the run
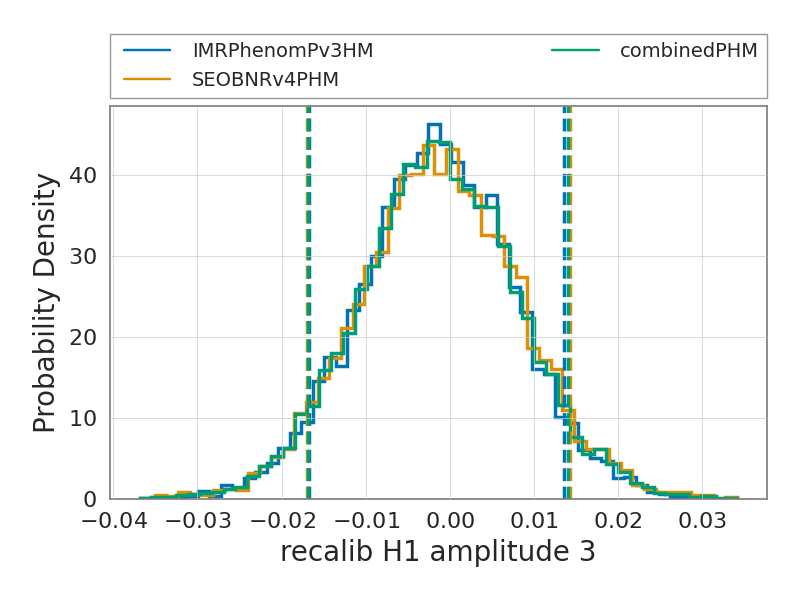
recalib_H1_amplitude_3
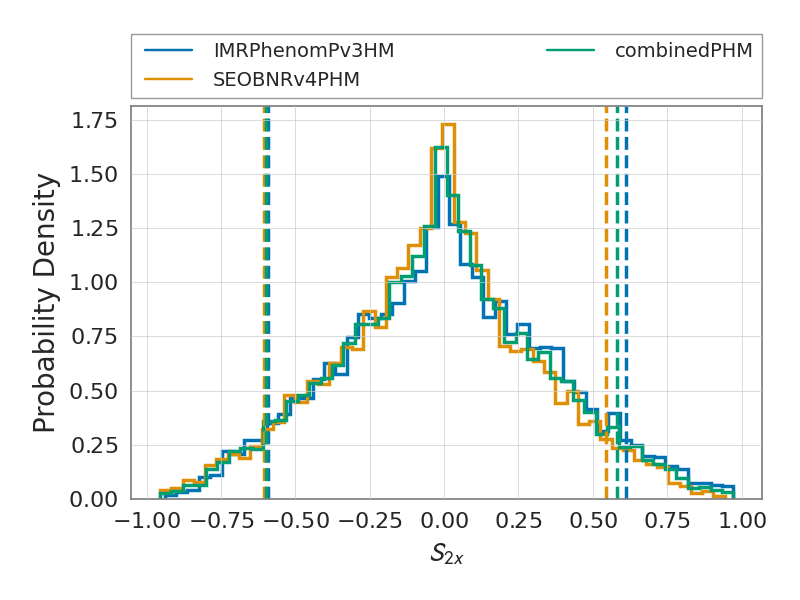
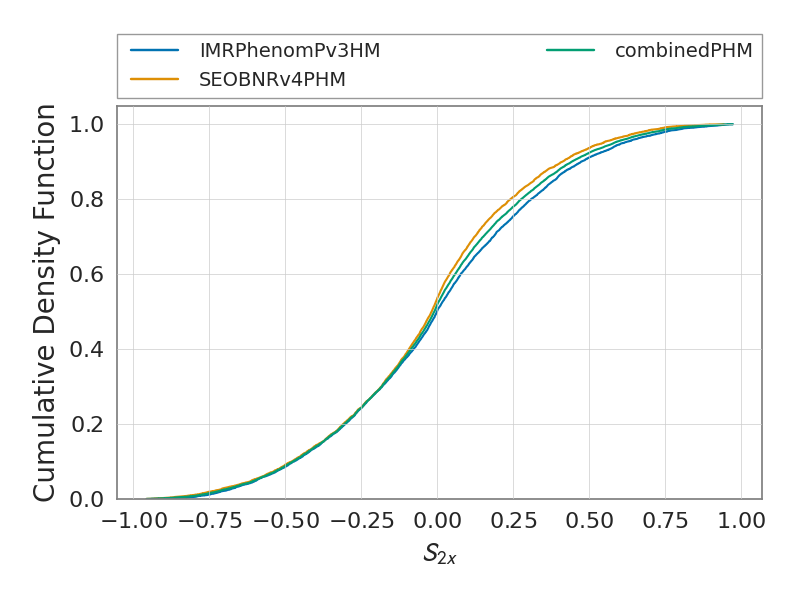
The figures below show the summary plots for the run
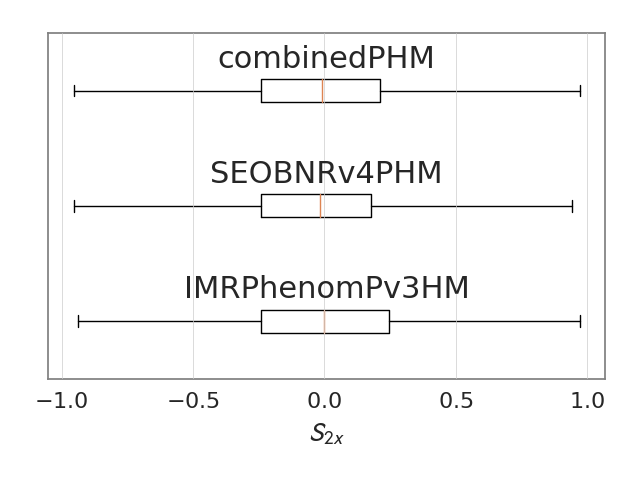
spin_2x
The figures below show the summary plots for the run
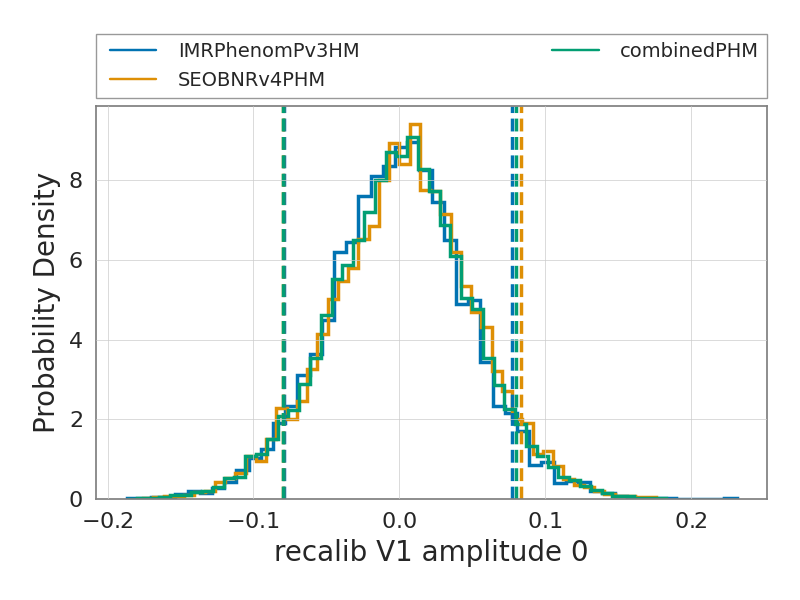
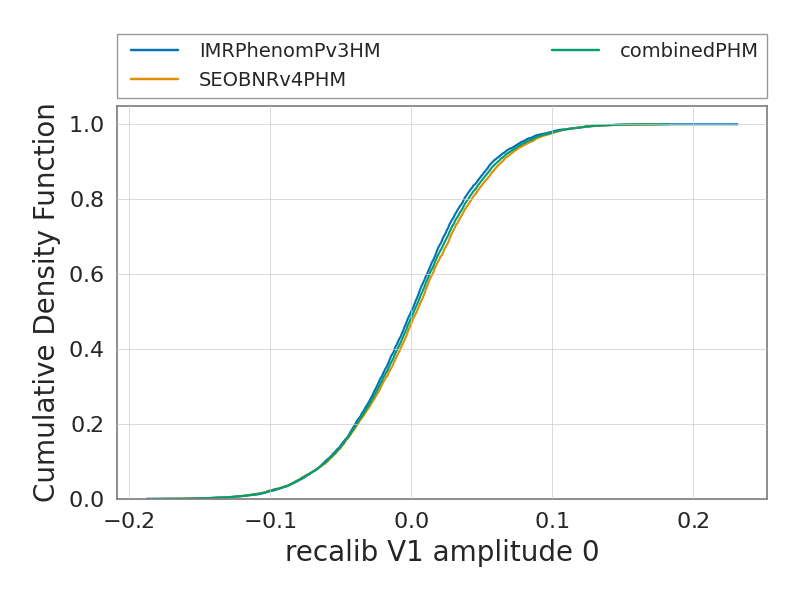
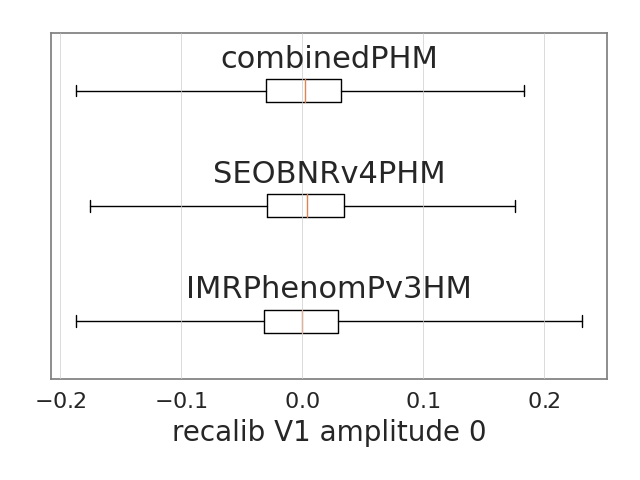
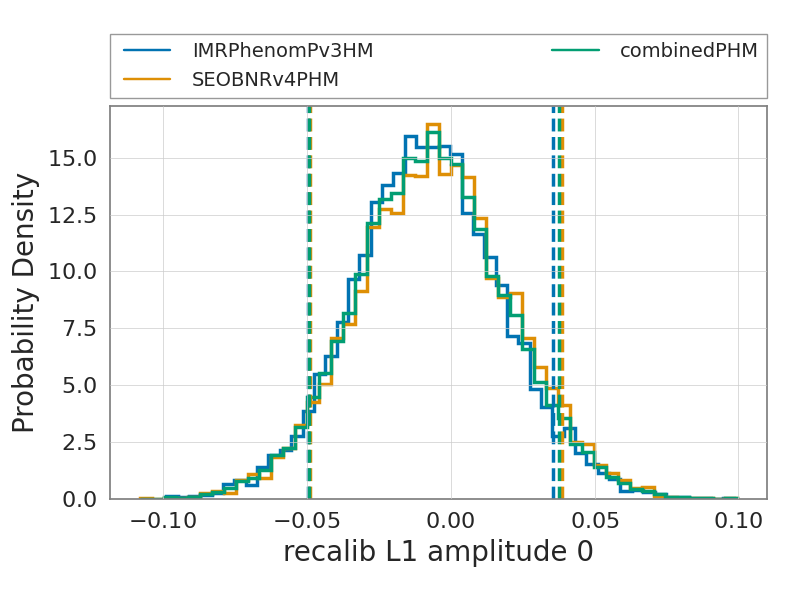
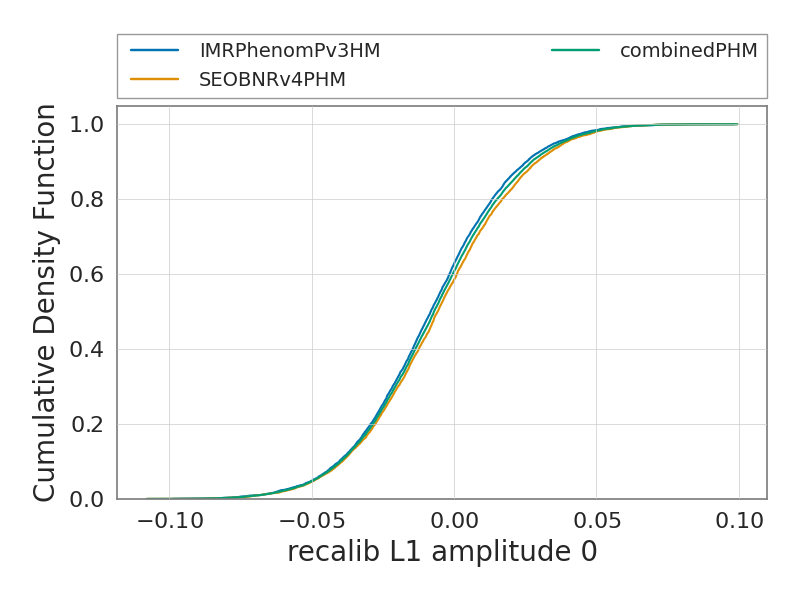
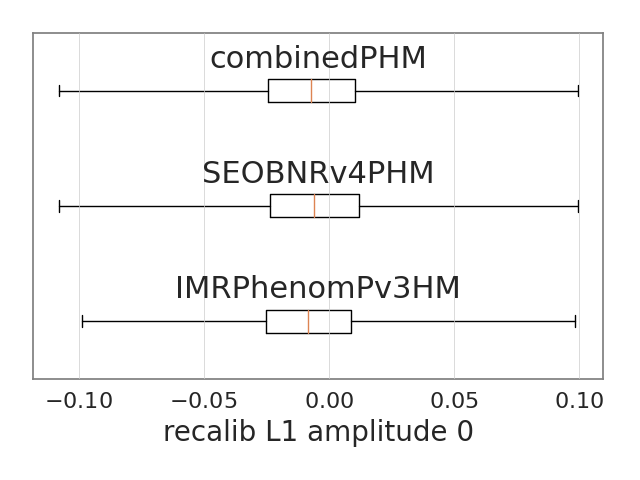
recalib_V1_amplitude_0
The figures below show the summary plots for the run
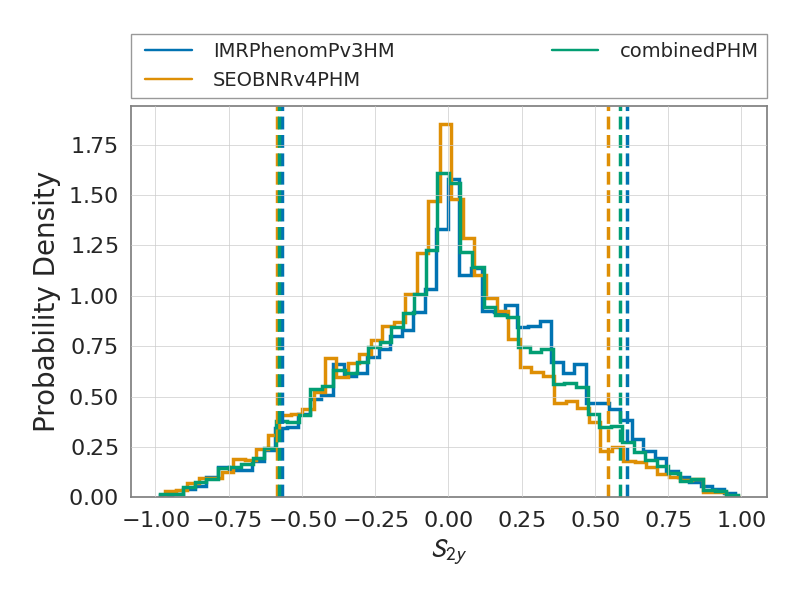
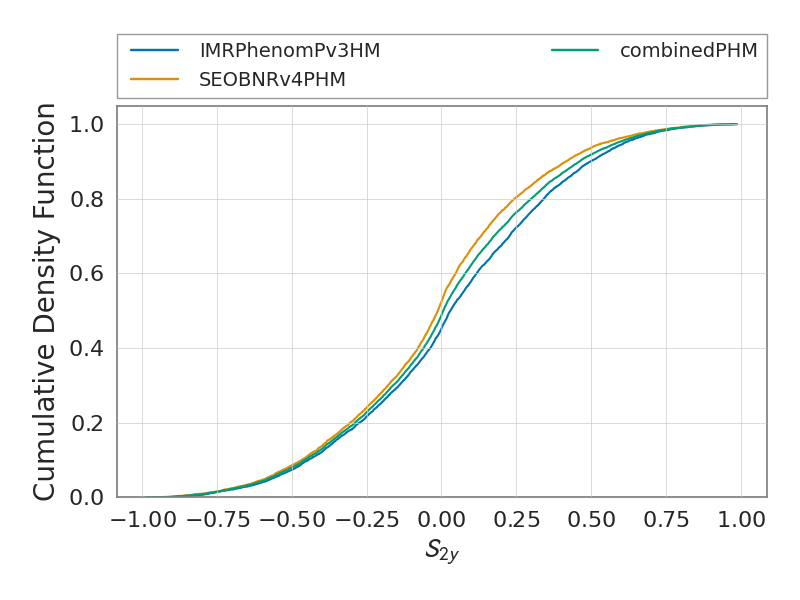
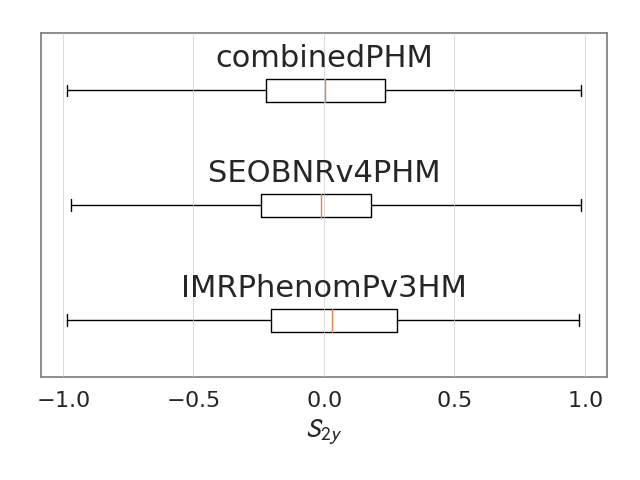
spin_2y
The figures below show the summary plots for the run
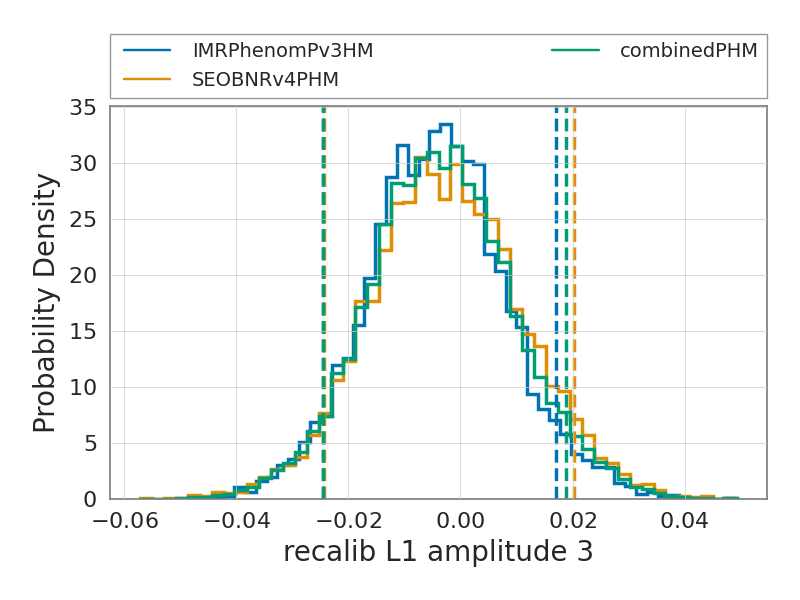
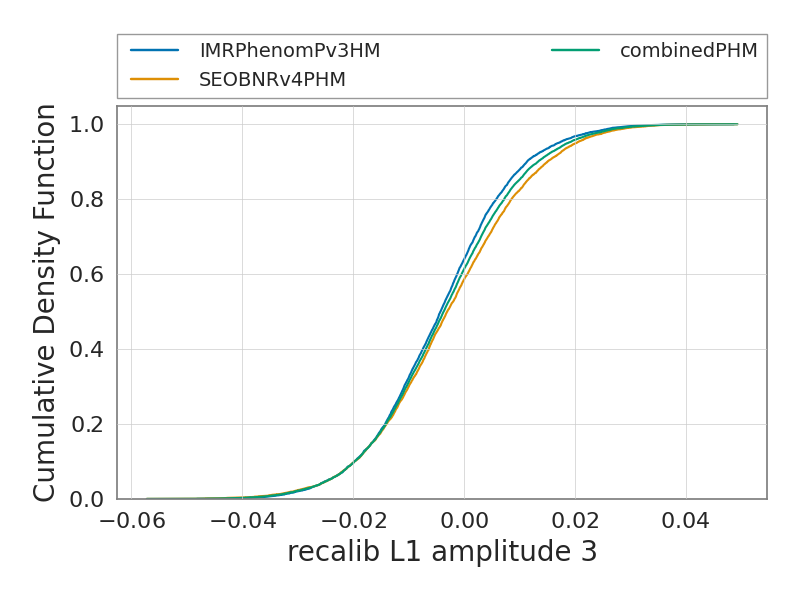
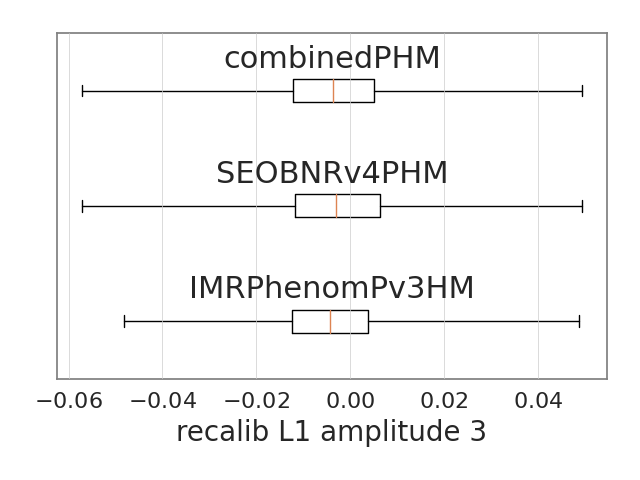
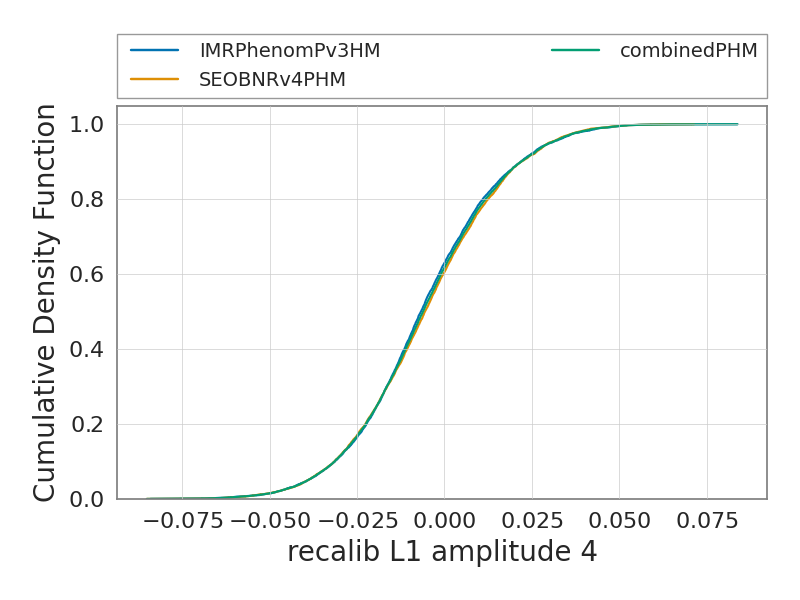
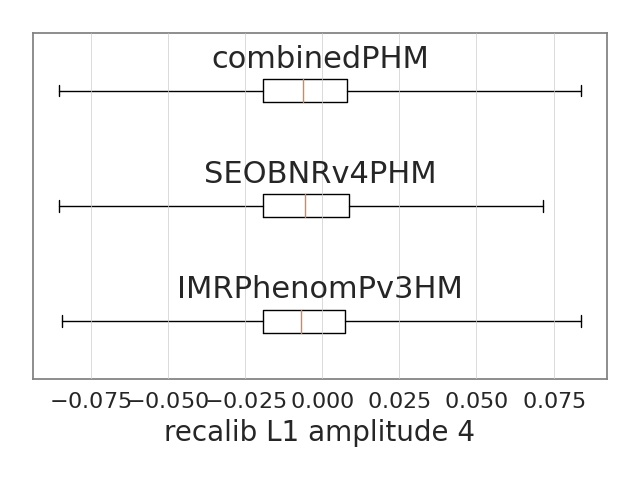
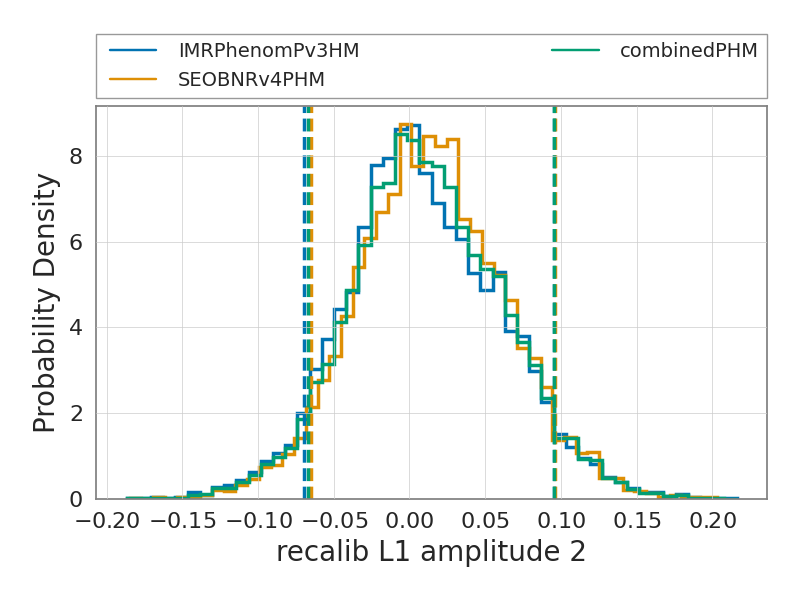
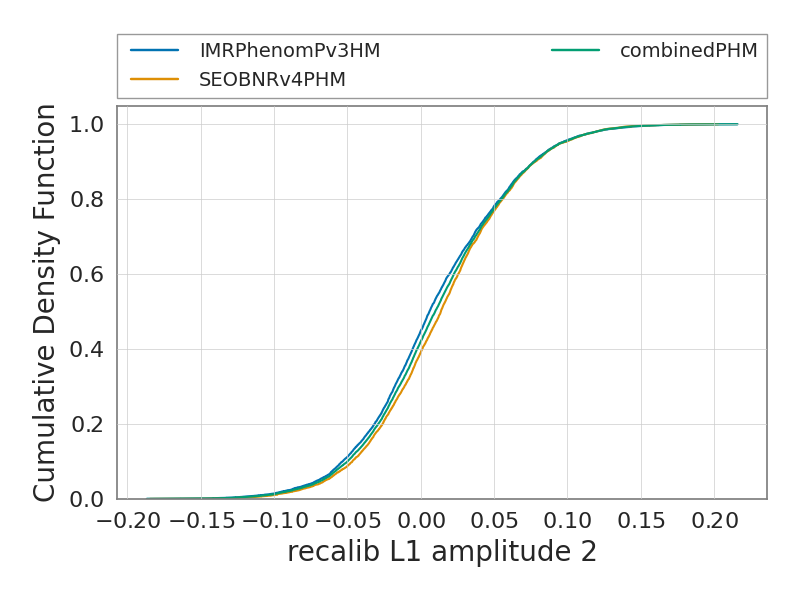
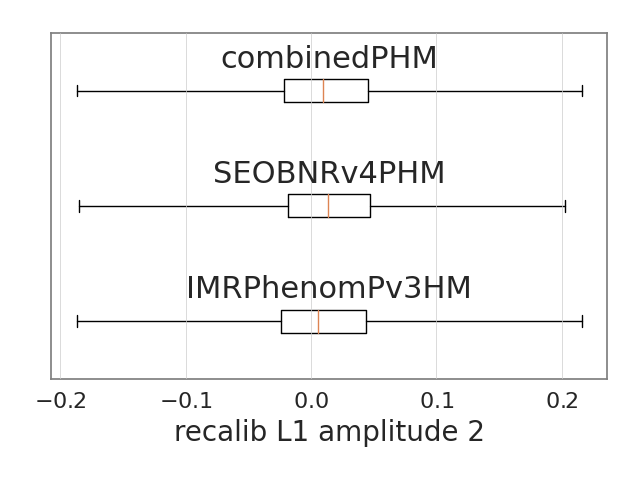
recalib_L1_amplitude_3
The figures below show the summary plots for the run
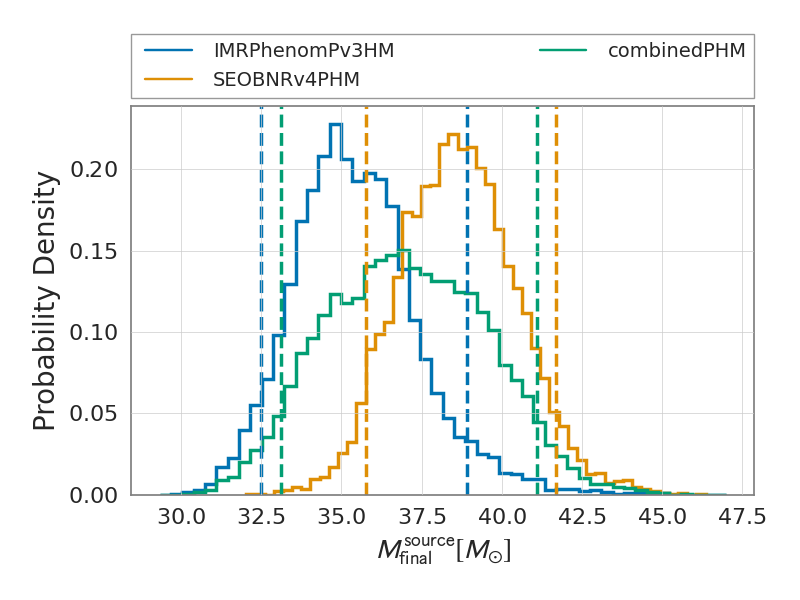
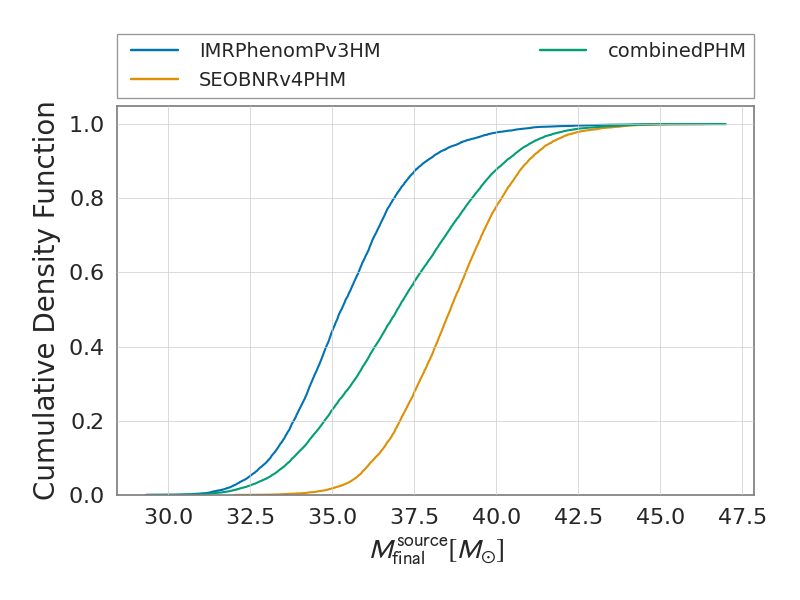
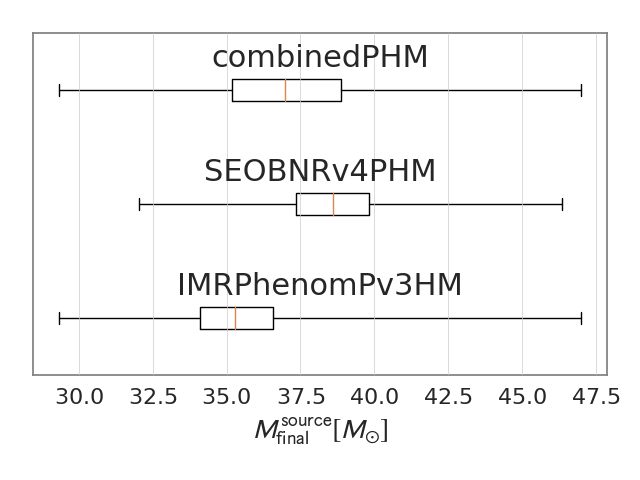
final_mass_source
The figures below show the summary plots for the run
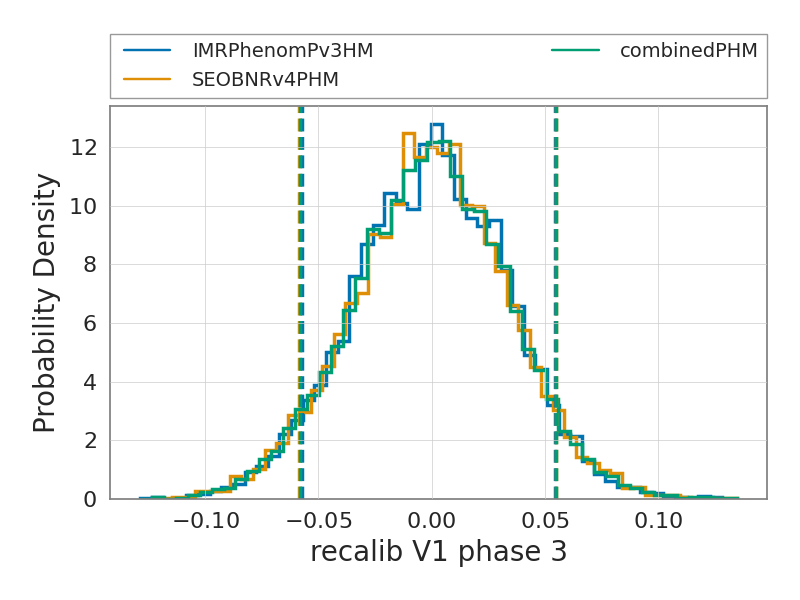
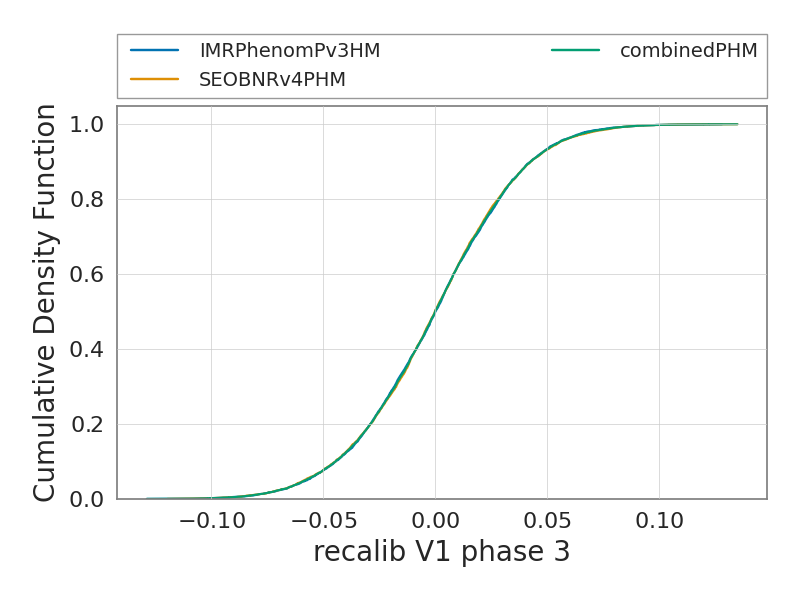
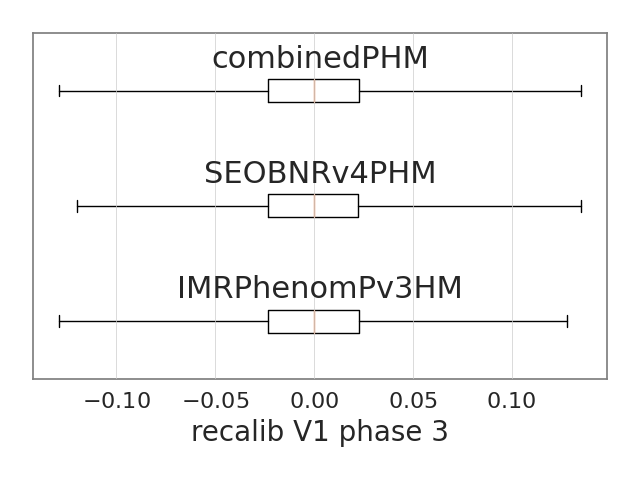
recalib_V1_phase_3
The figures below show the summary plots for the run
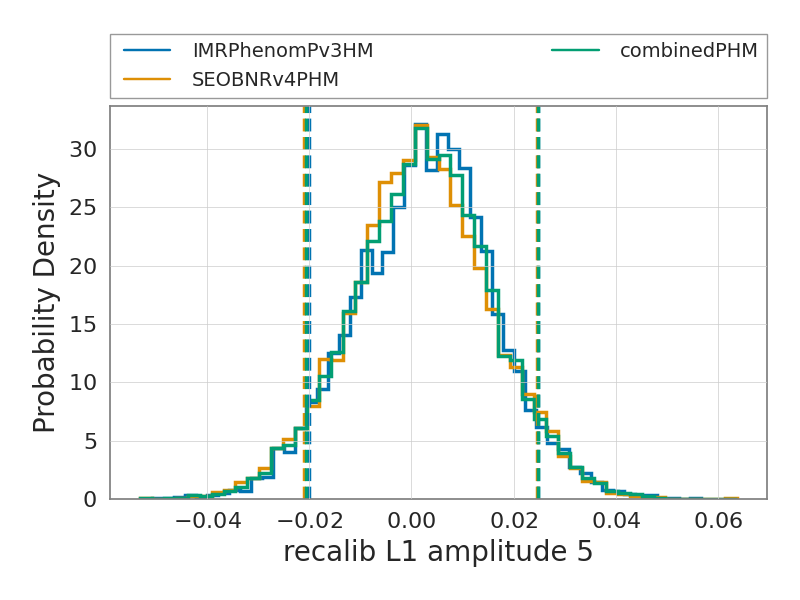
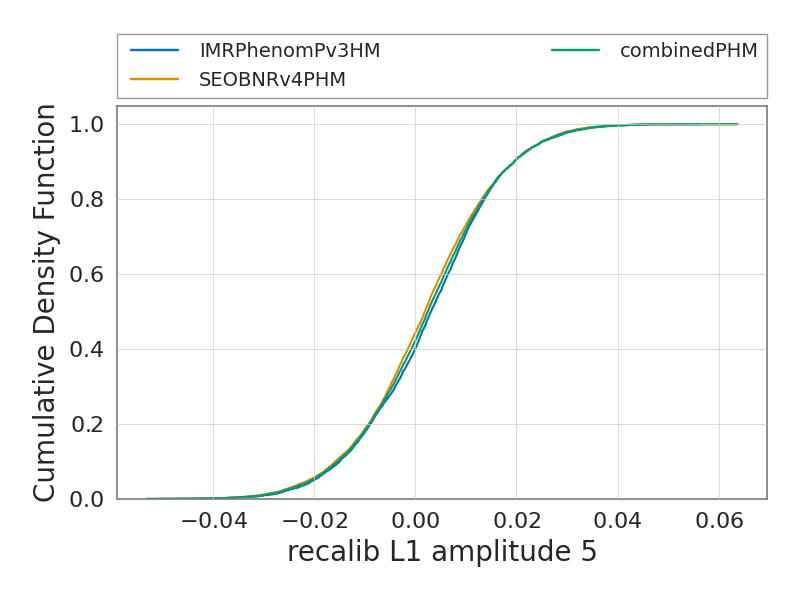
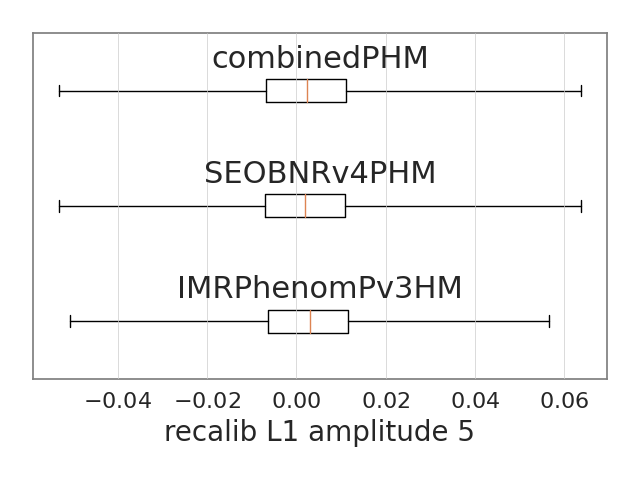
recalib_L1_amplitude_5
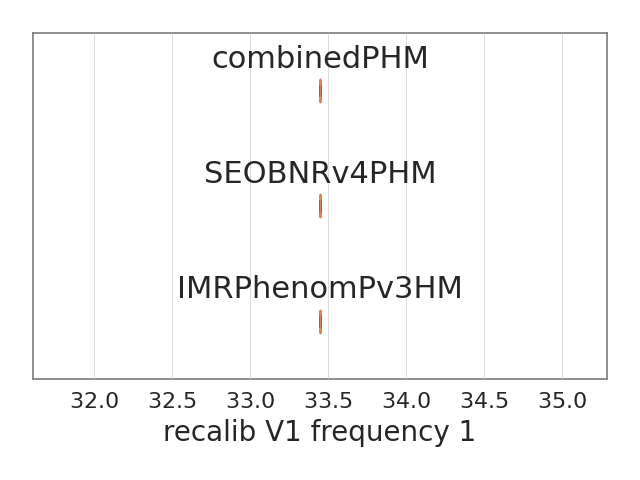
The figures below show the summary plots for the run
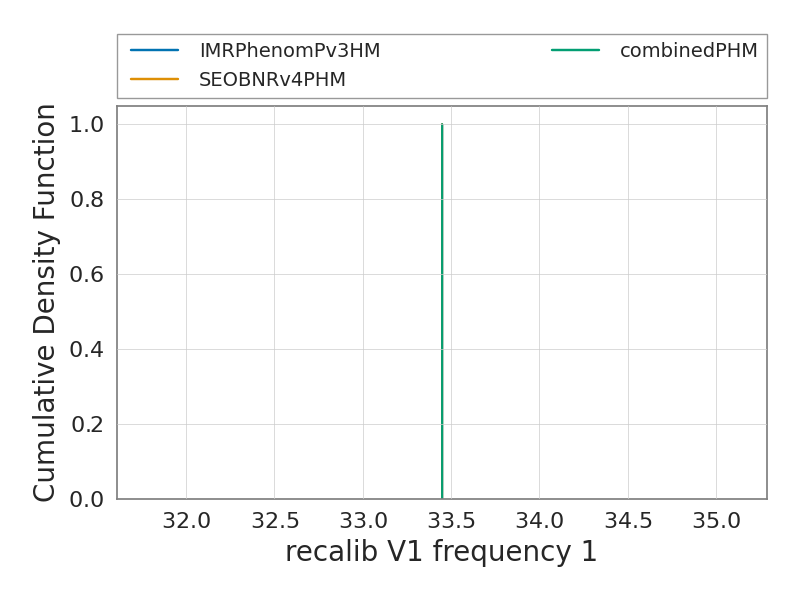
recalib_V1_frequency_1
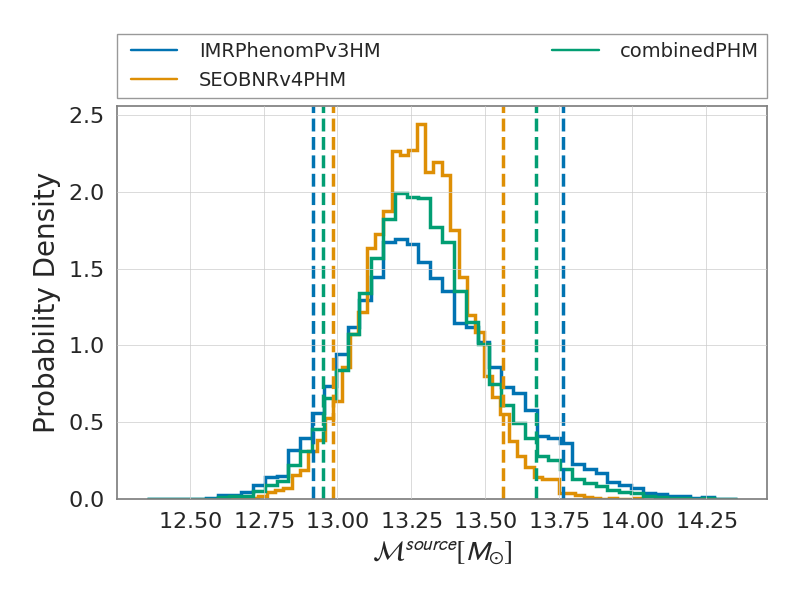
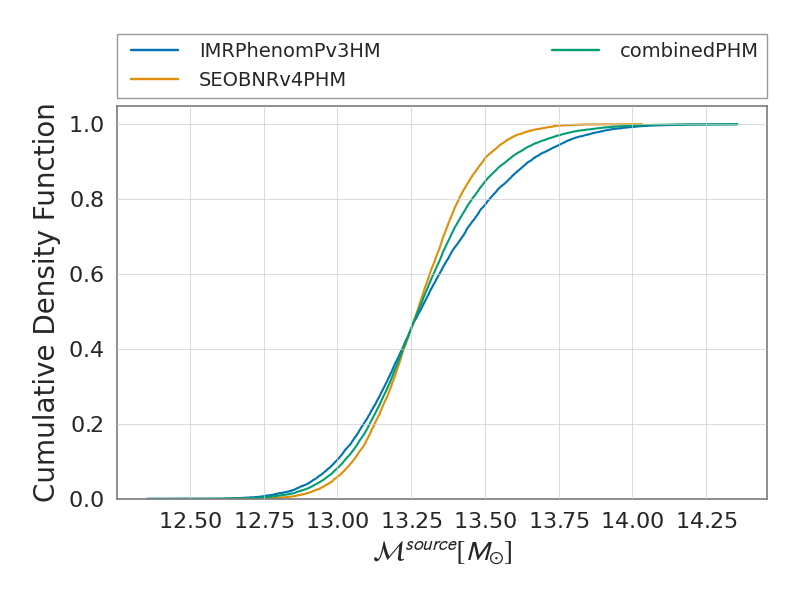
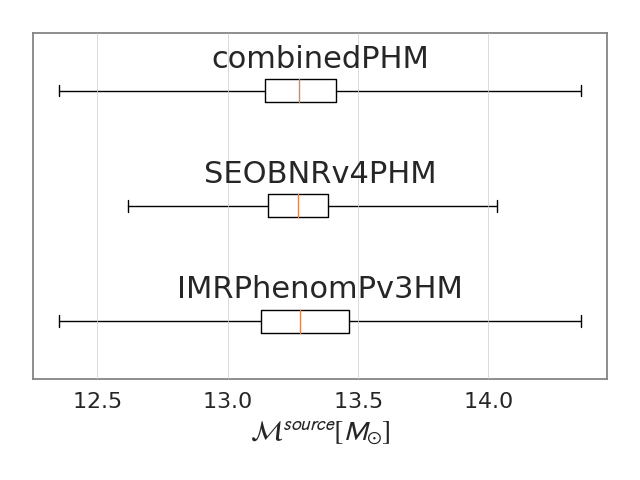
The figures below show the summary plots for the run
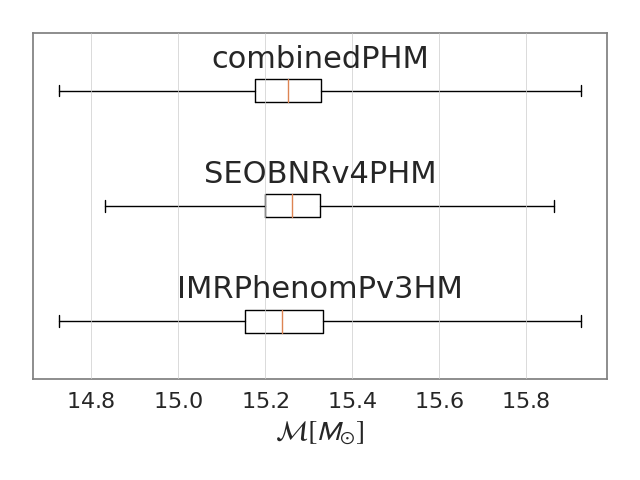
chirp_mass_source
The figures below show the summary plots for the run
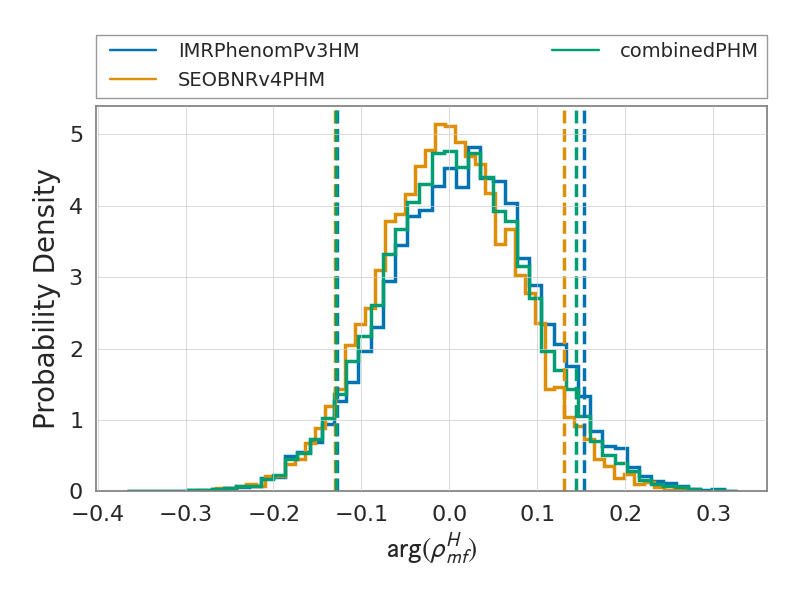
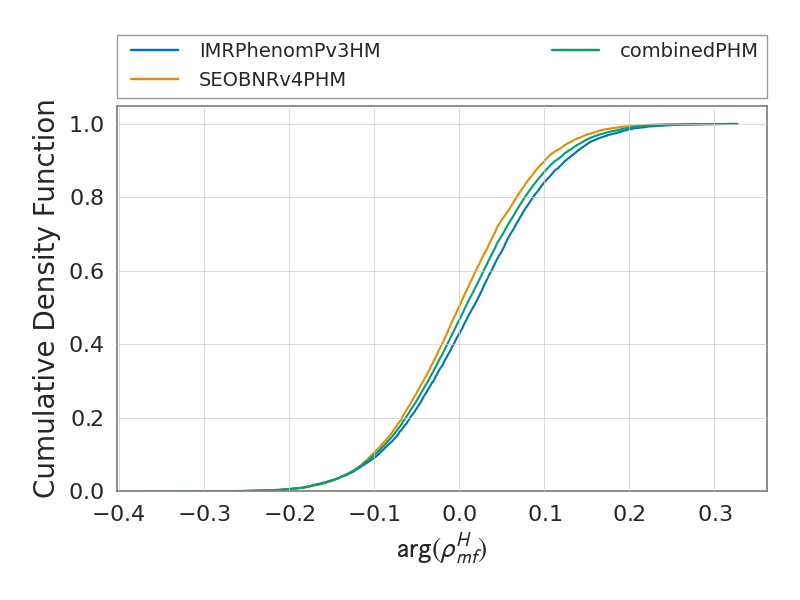
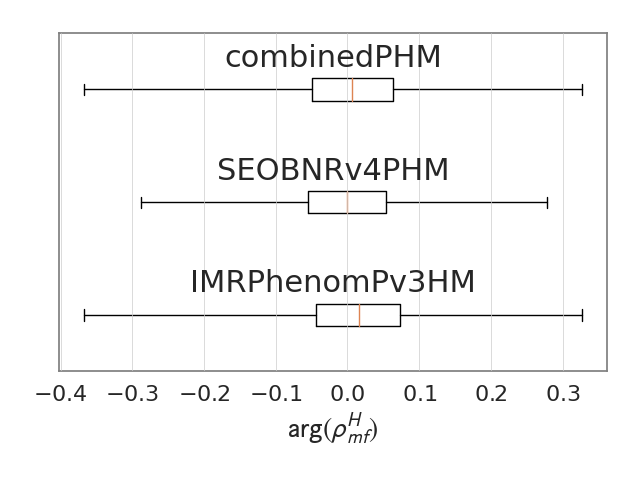
H1_matched_filter_snr_angle
The figures below show the summary plots for the run
recalib_L1_frequency_4
The figures below show the summary plots for the run
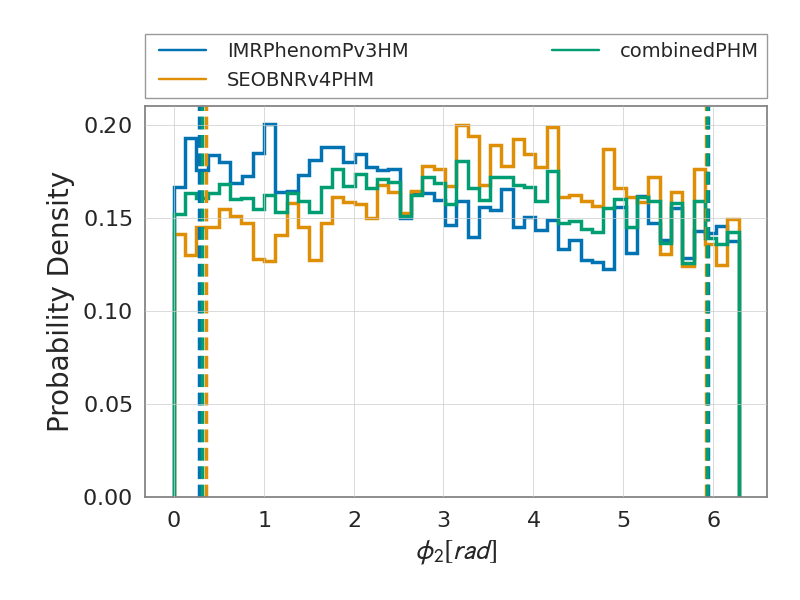
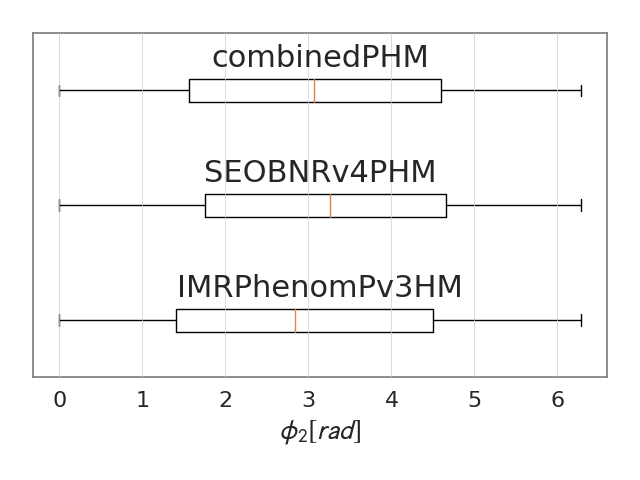
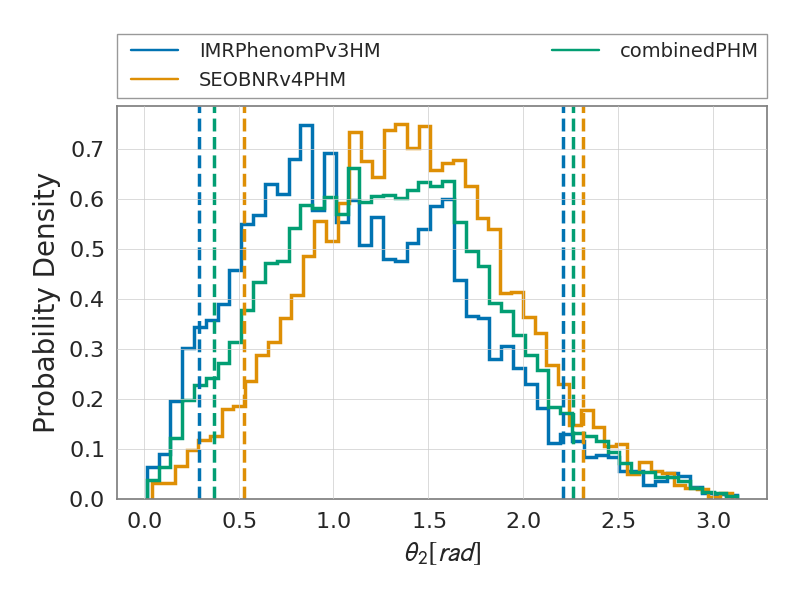
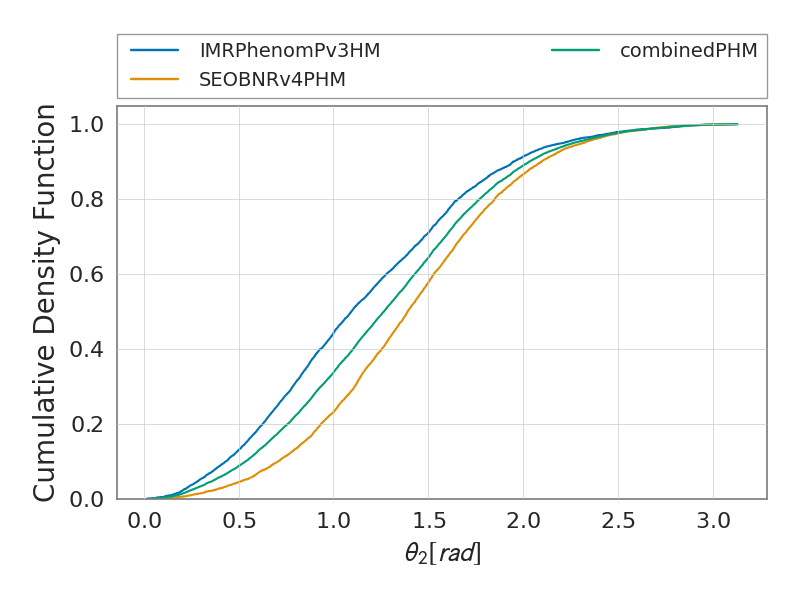
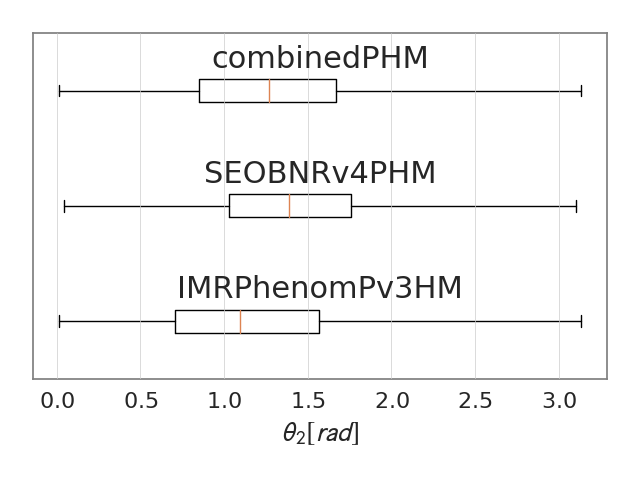
phi_2
The figures below show the summary plots for the run
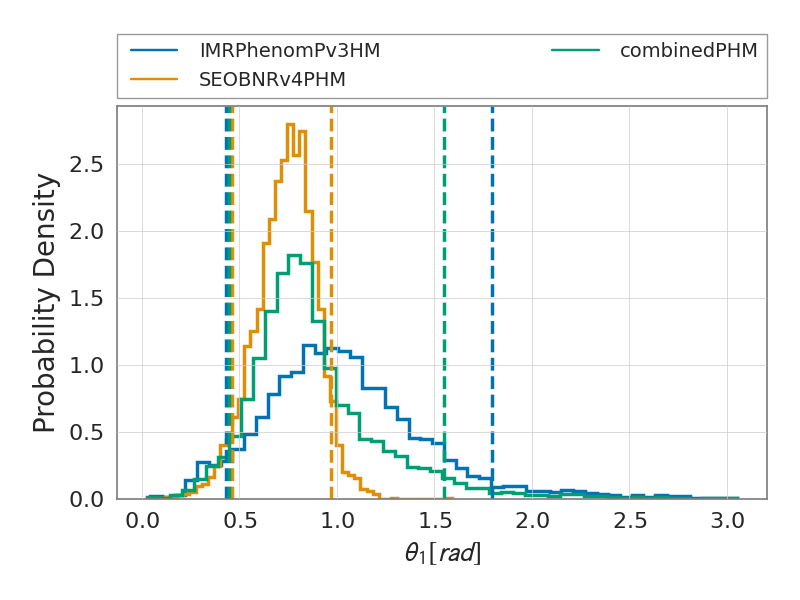
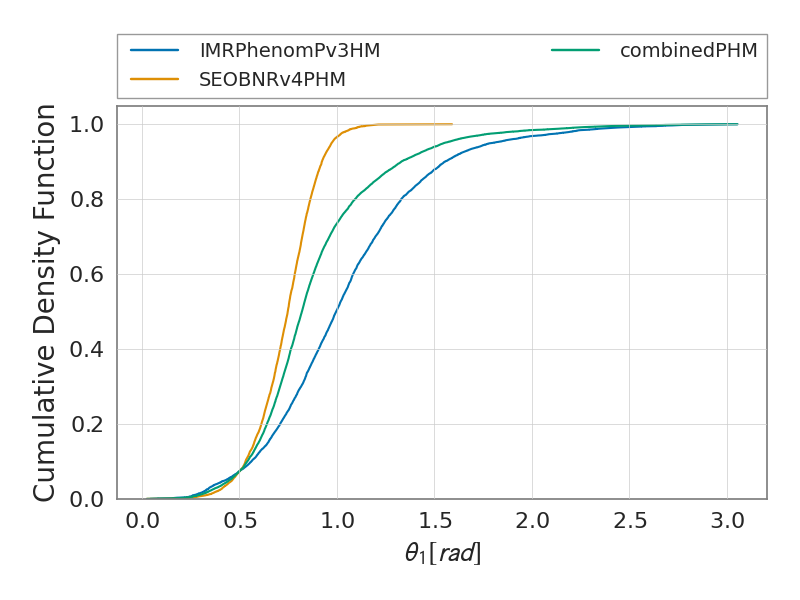
tilt_1
The figures below show the summary plots for the run
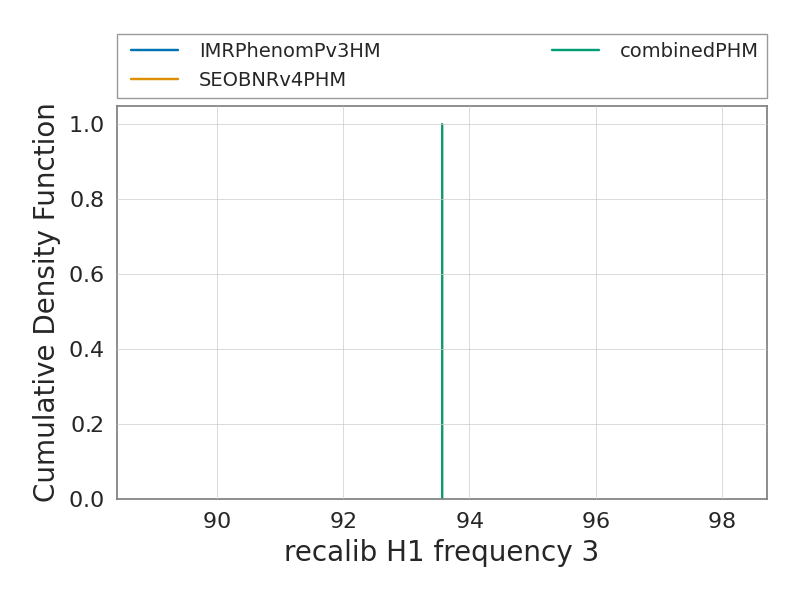
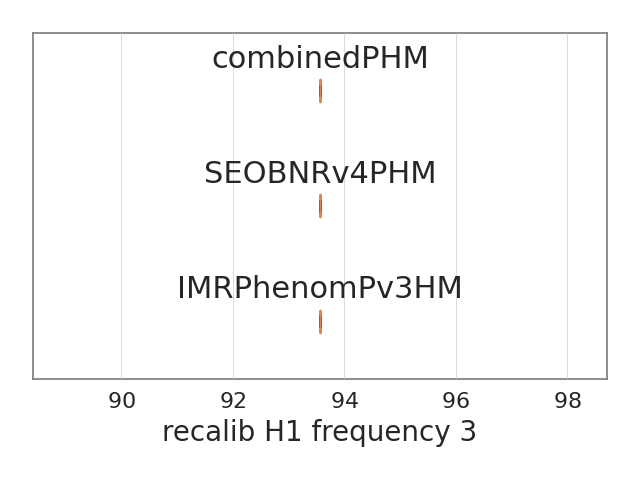
recalib_H1_frequency_3
The figures below show the summary plots for the run
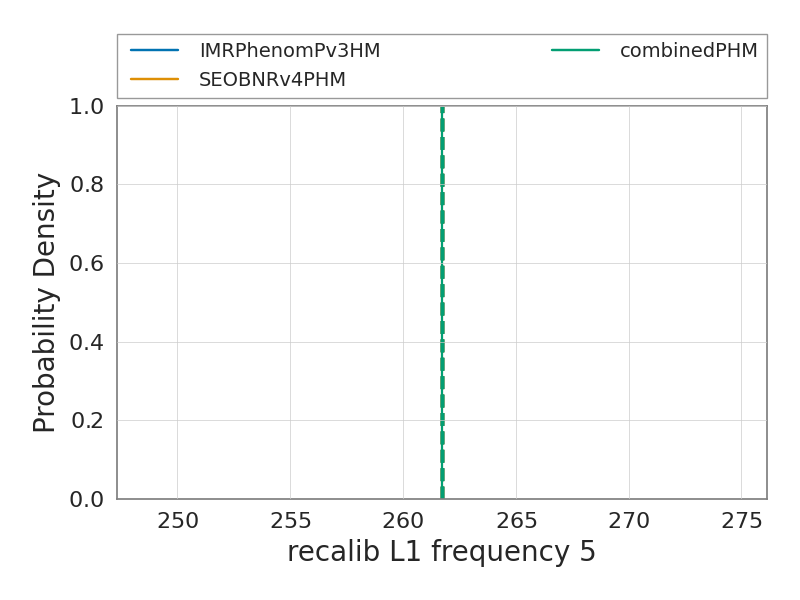
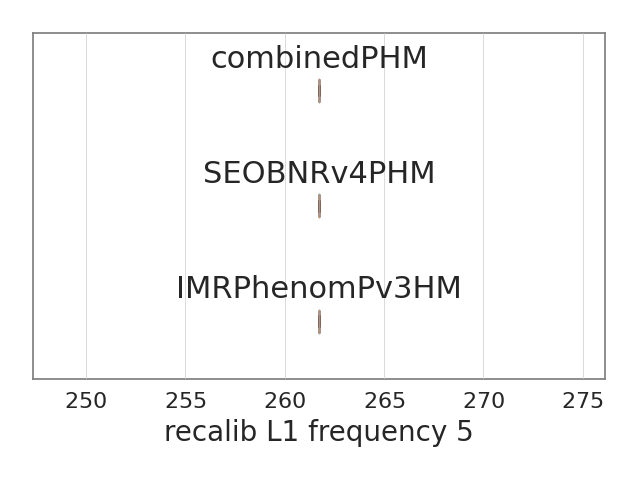
recalib_L1_frequency_5
The figures below show the summary plots for the run
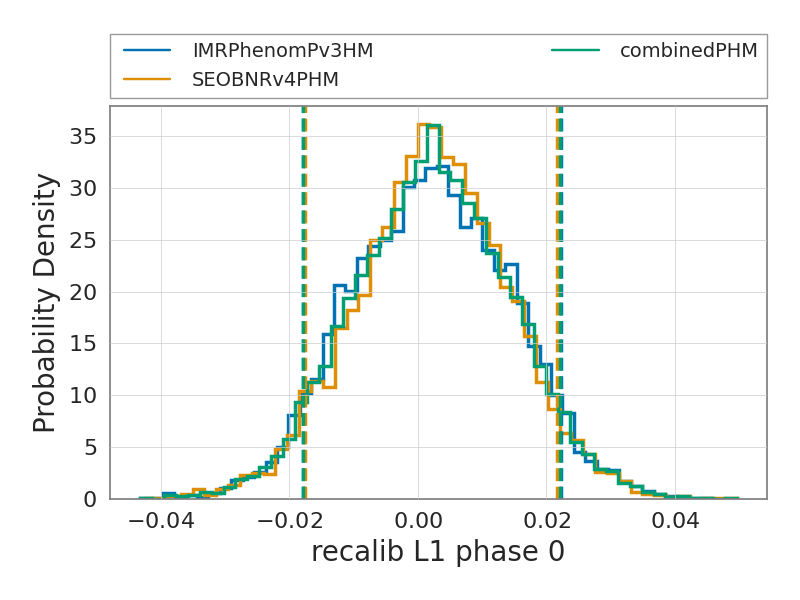
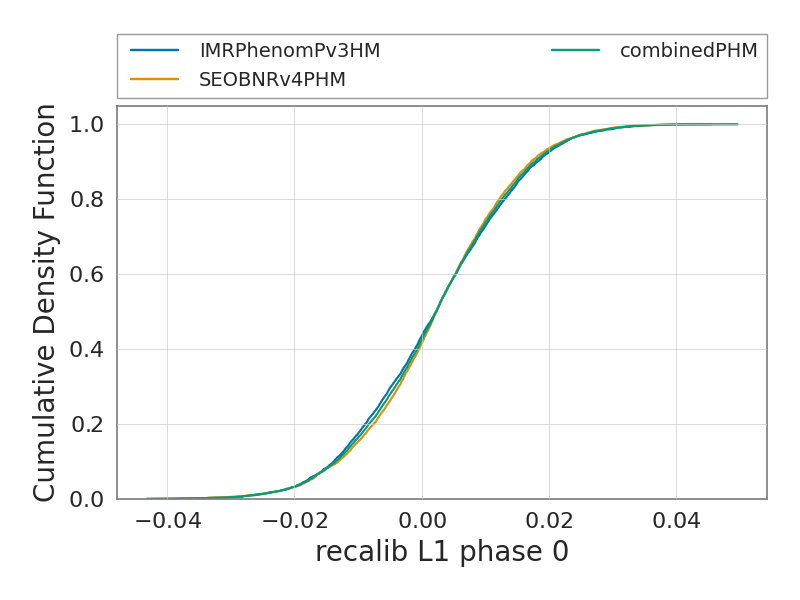
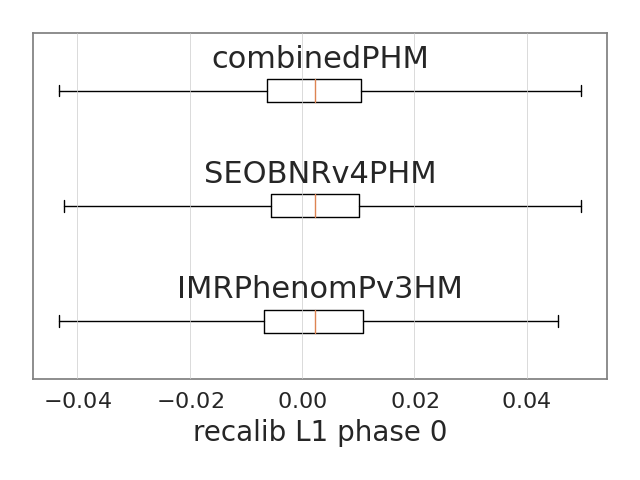
recalib_L1_phase_0
The figures below show the summary plots for the run
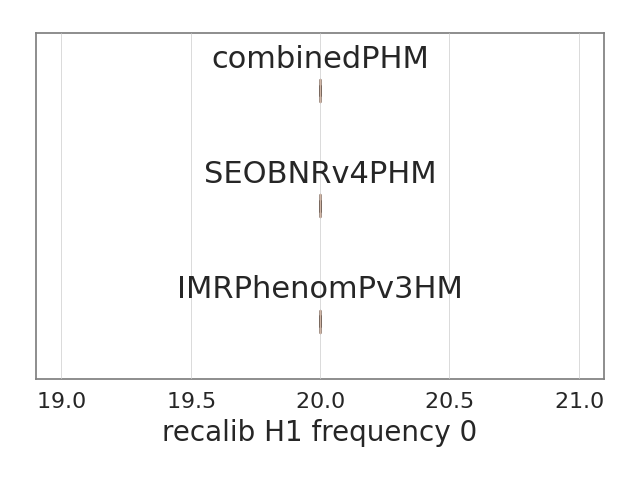
recalib_H1_frequency_0
The figures below show the summary plots for the run
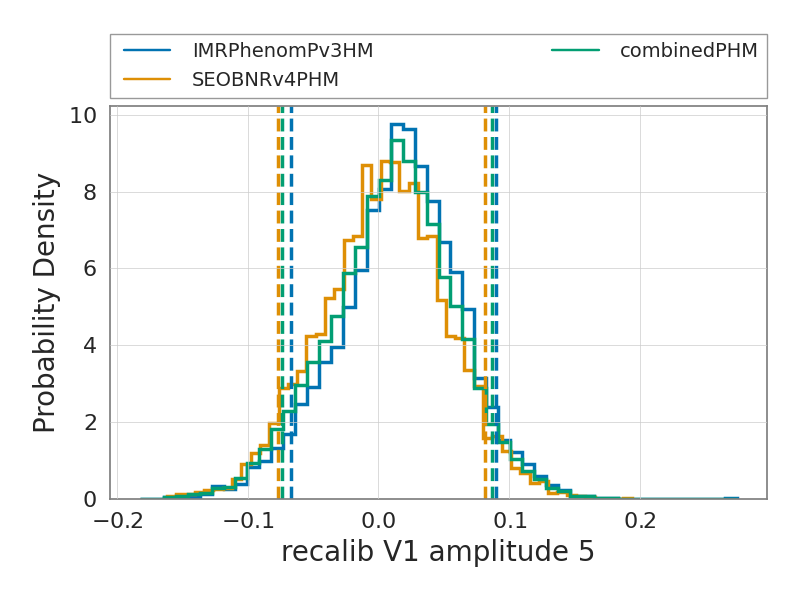
recalib_V1_amplitude_5
The figures below show the summary plots for the run
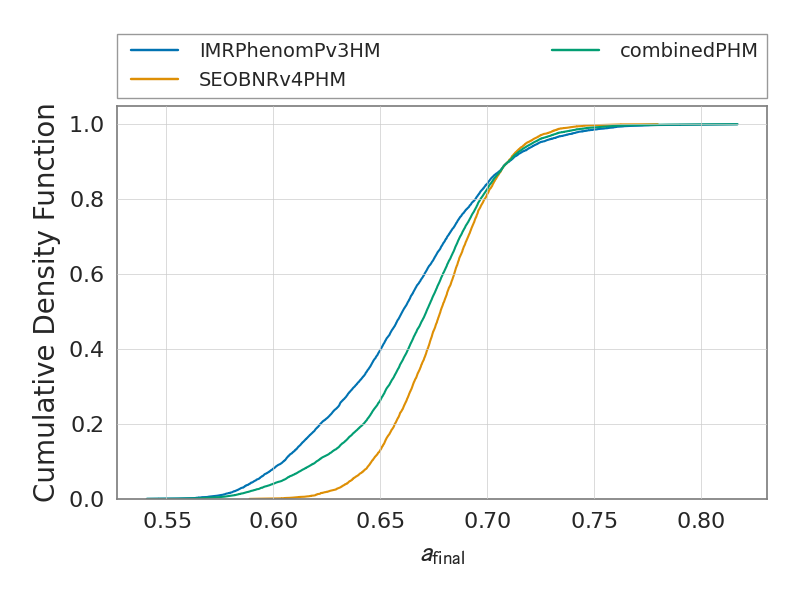
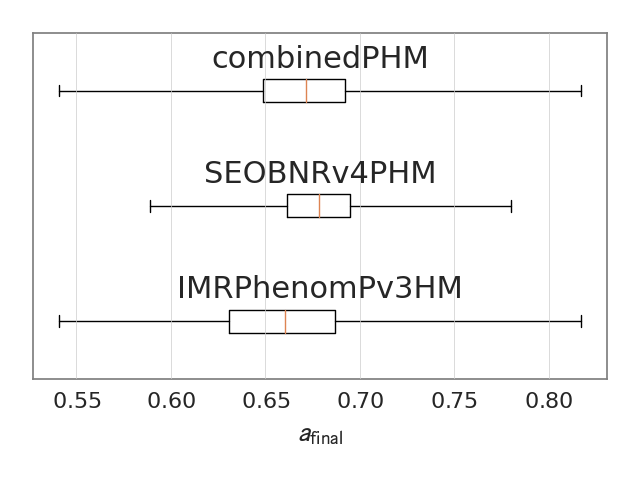
final_spin
The figures below show the summary plots for the run
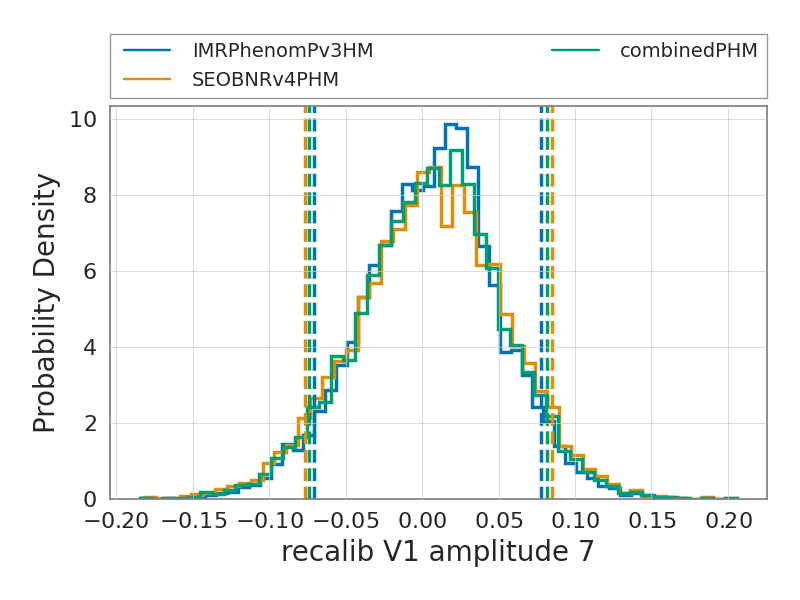
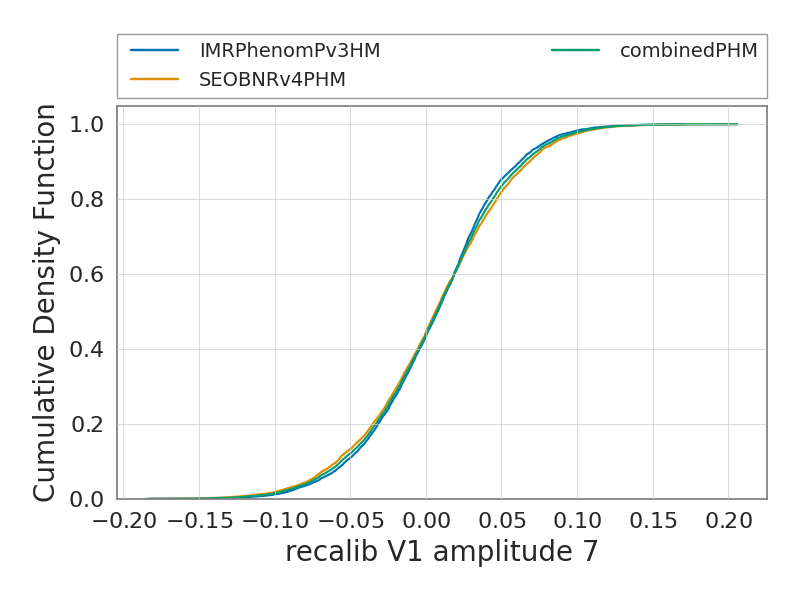
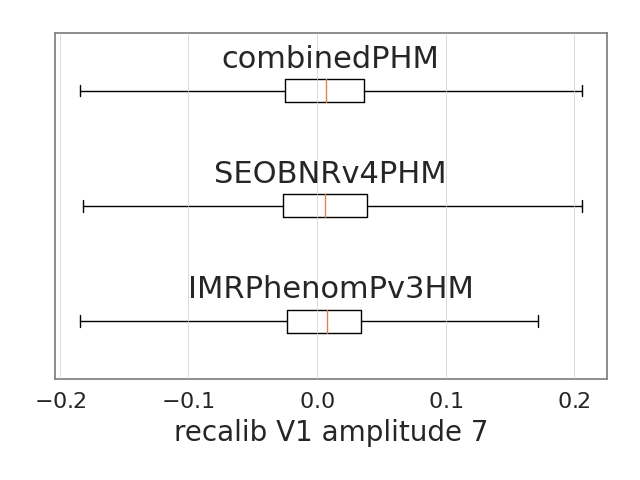
recalib_V1_amplitude_7
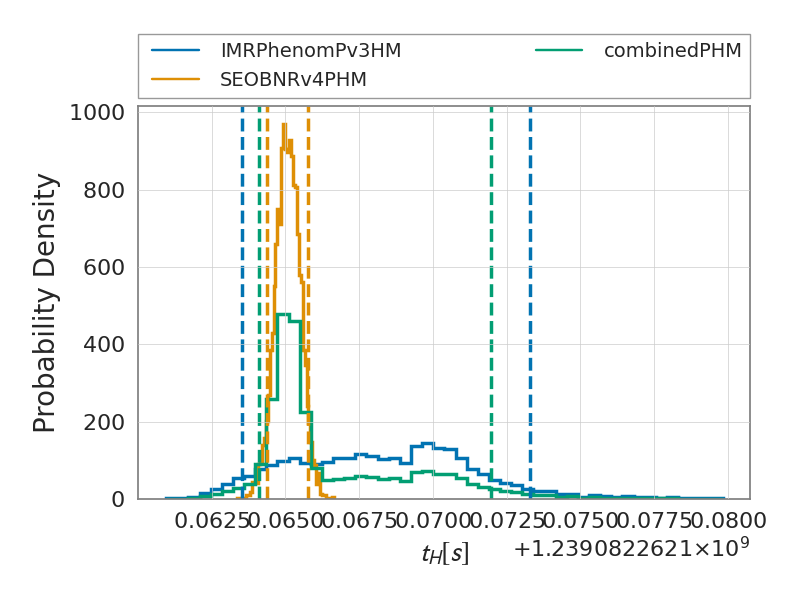
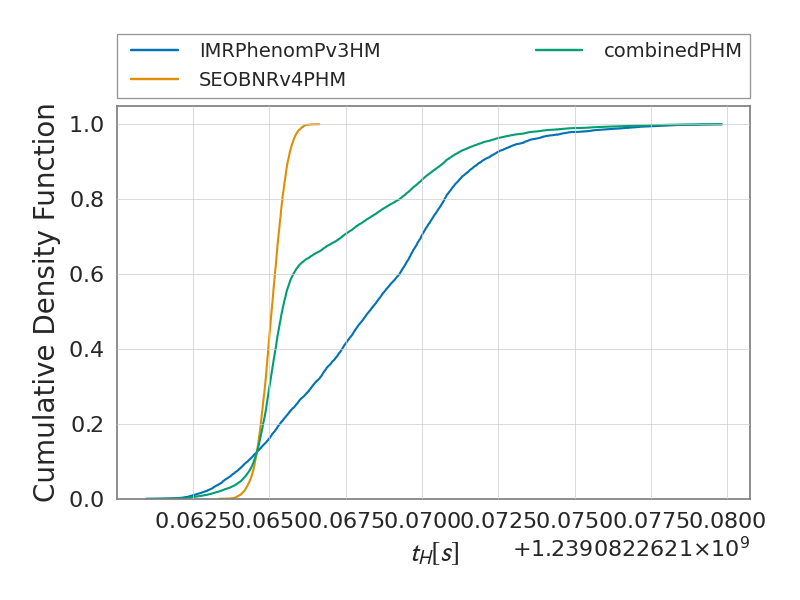
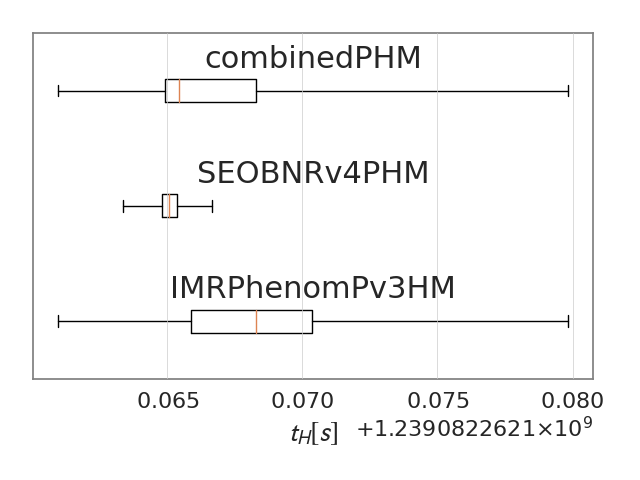
The figures below show the summary plots for the run
H1_time
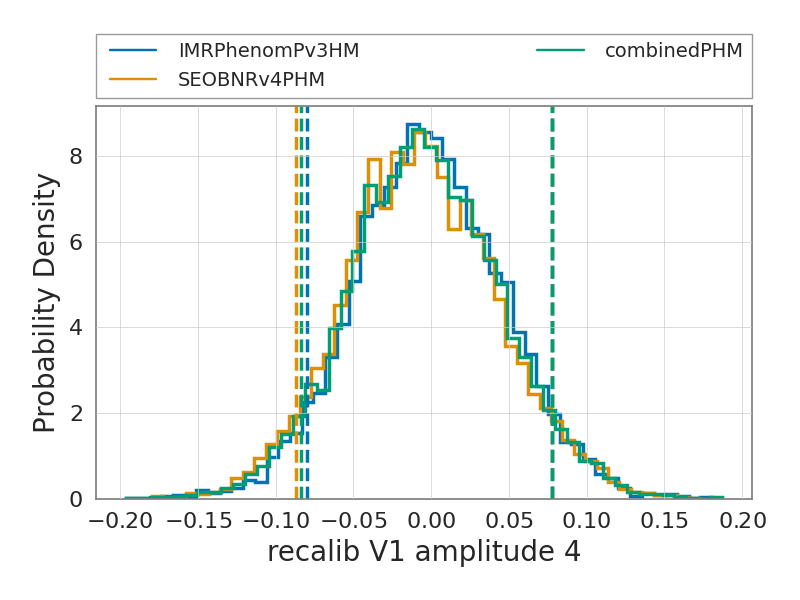
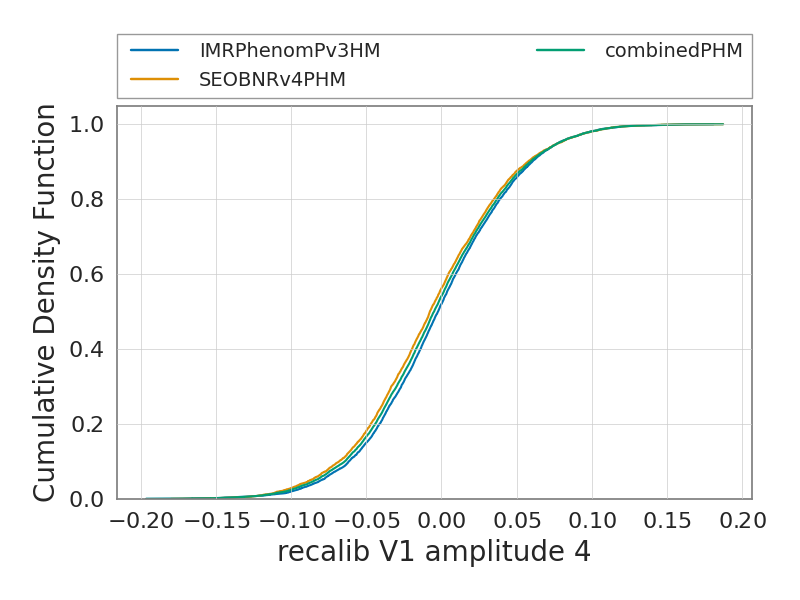
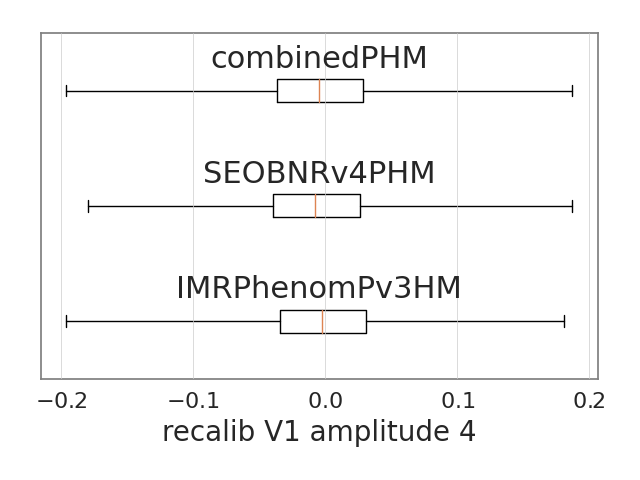
The figures below show the summary plots for the run
recalib_V1_amplitude_4
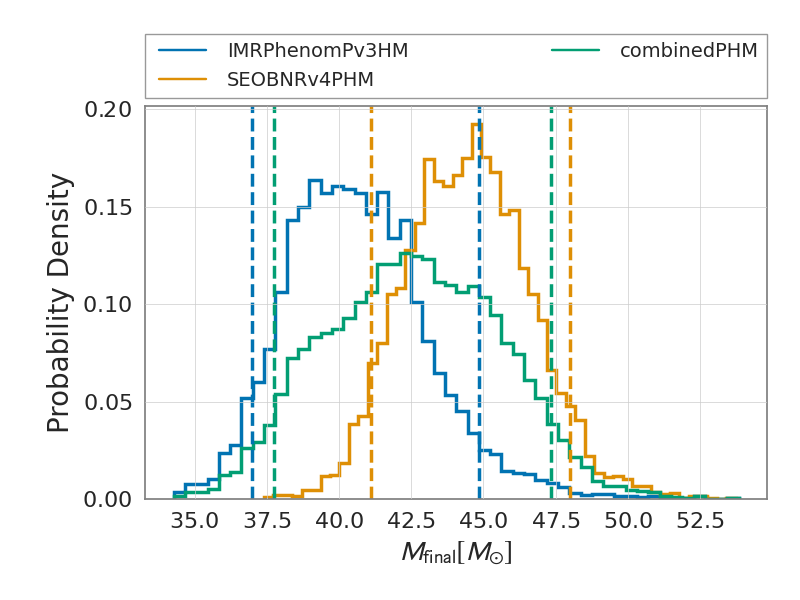
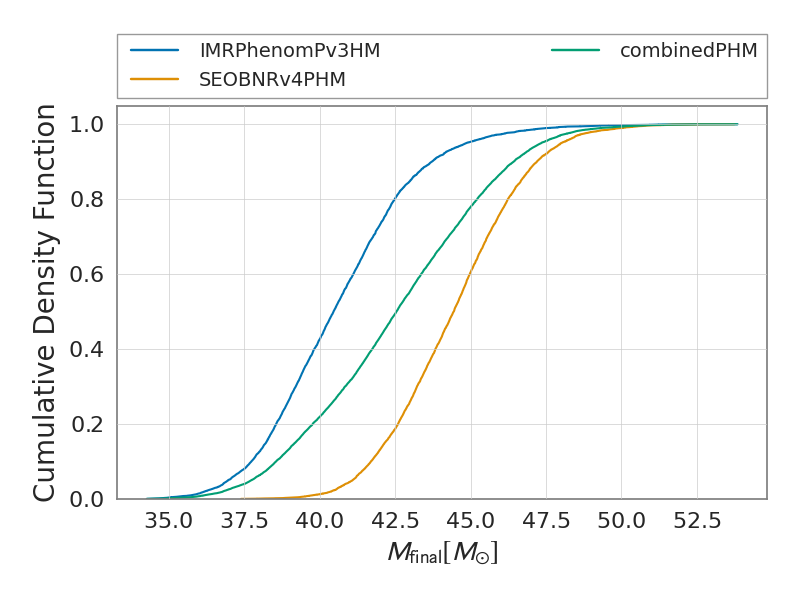
The figures below show the summary plots for the run
final_mass
The figures below show the summary plots for the run
recalib_L1_amplitude_0
The figures below show the summary plots for the run
L1_matched_filter_snr_angle
The figures below show the summary plots for the run
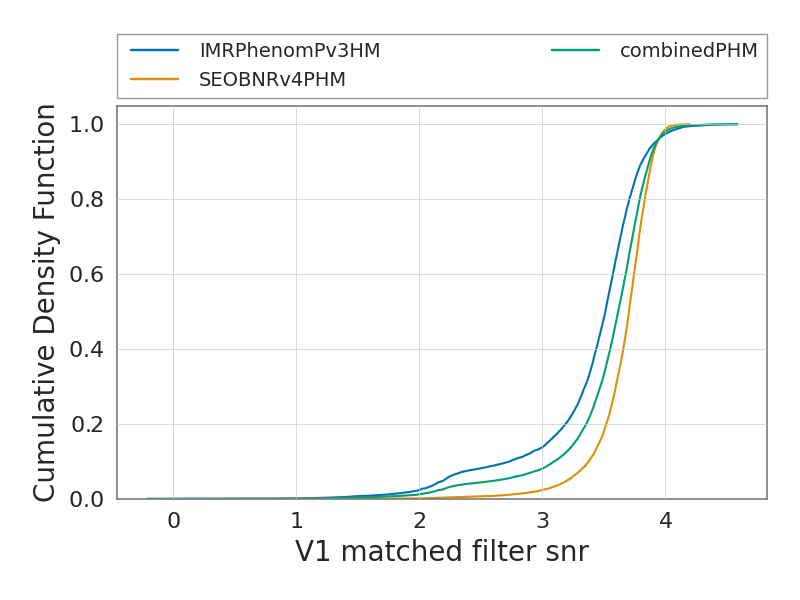
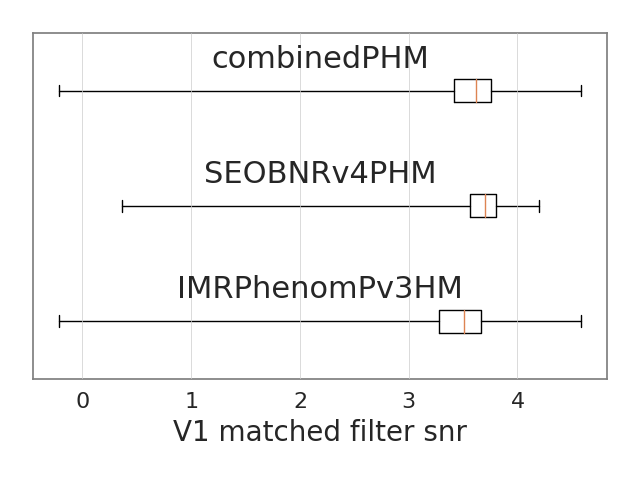
V1_matched_filter_snr
The figures below show the summary plots for the run
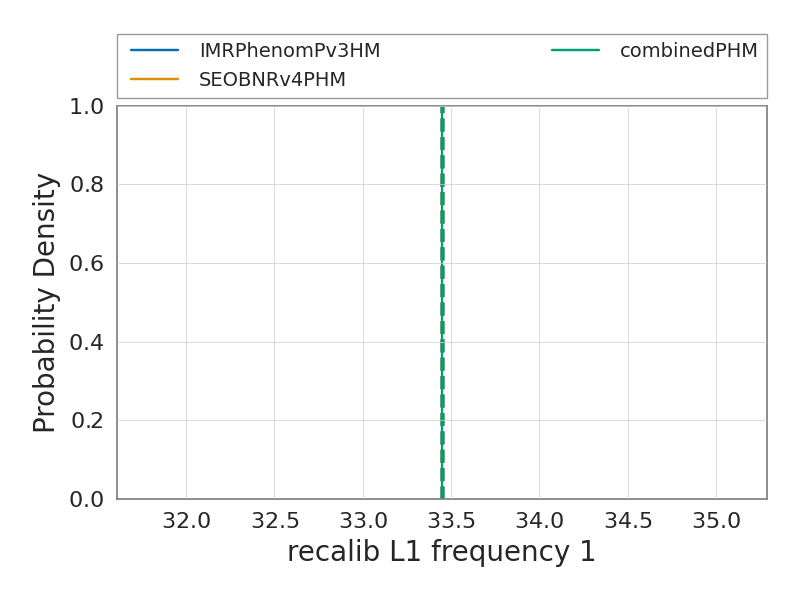
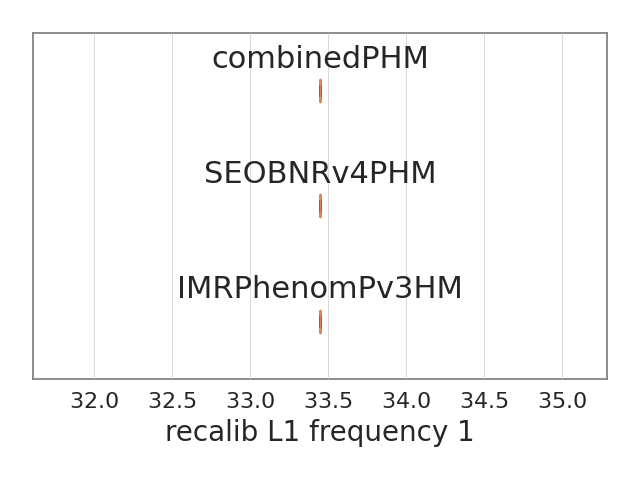
recalib_L1_frequency_1
The figures below show the summary plots for the run
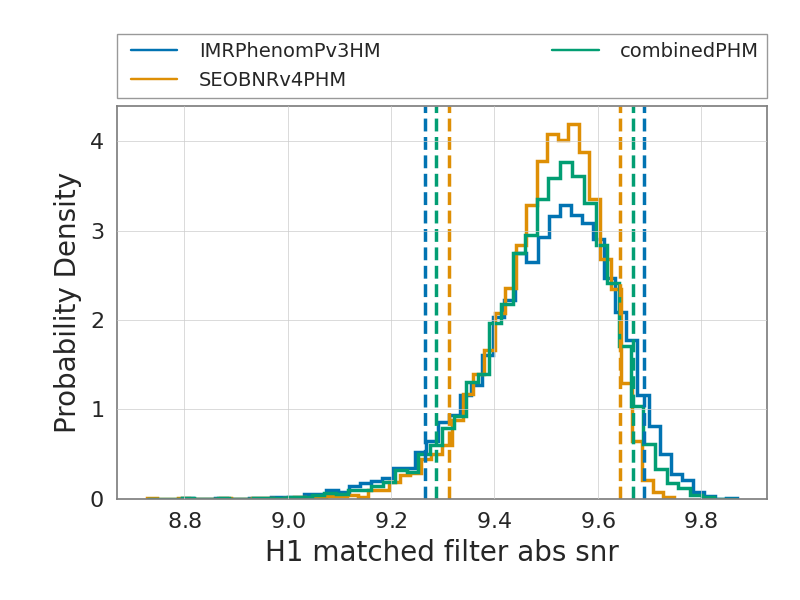
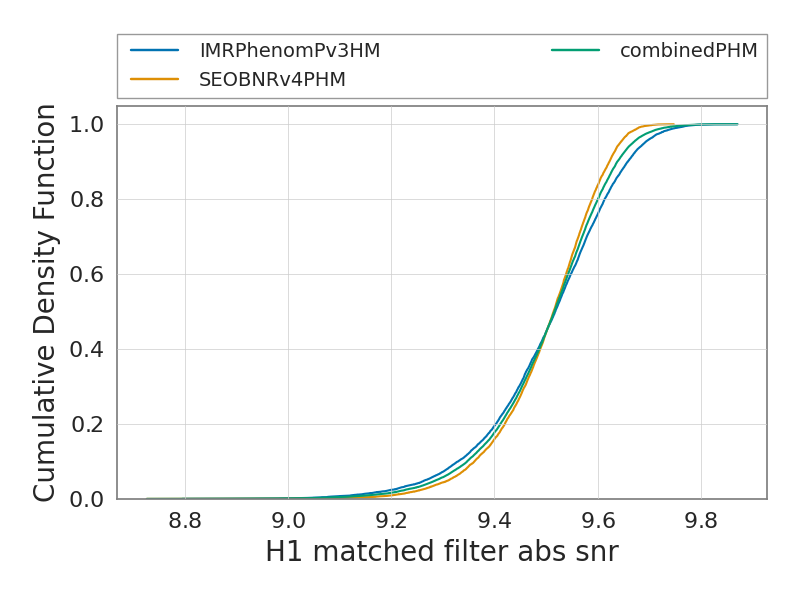
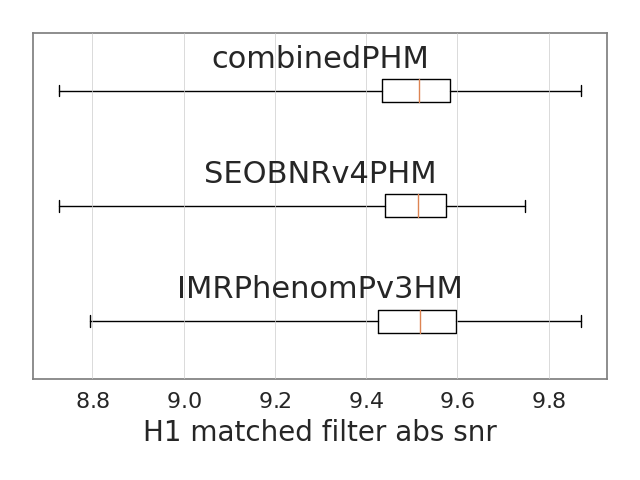
H1_matched_filter_abs_snr
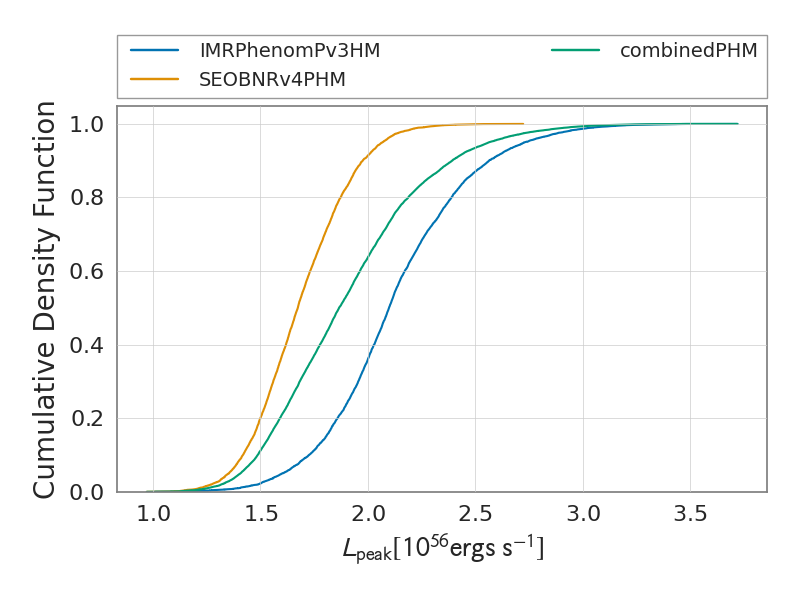
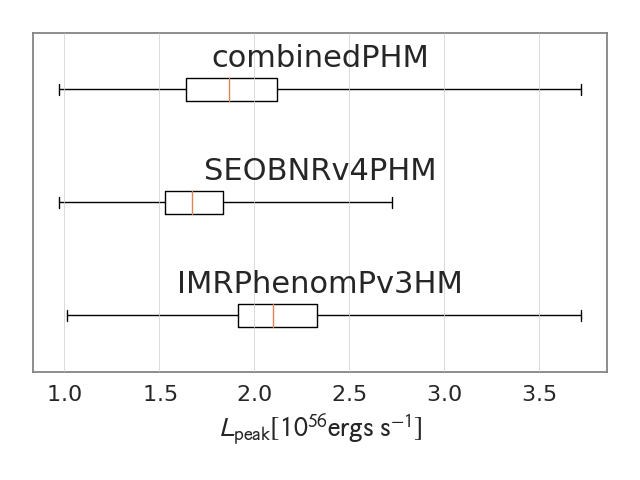
The figures below show the summary plots for the run
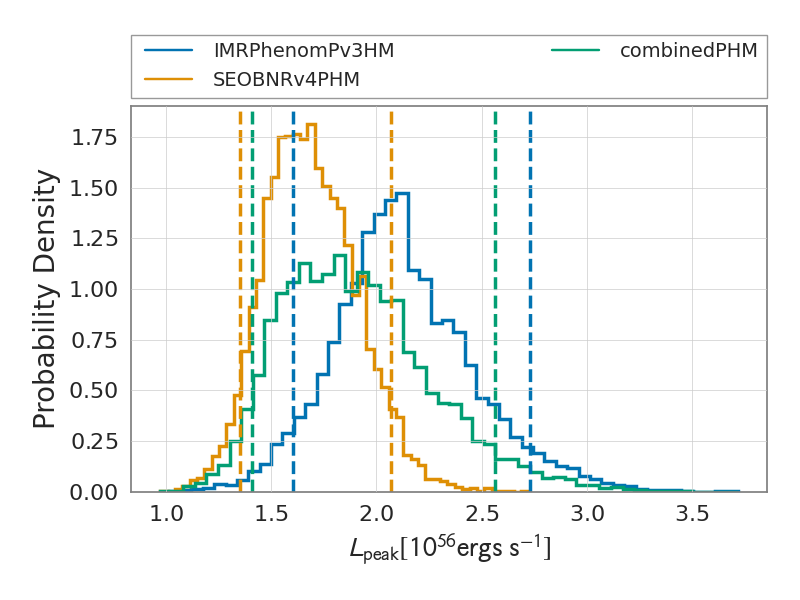
peak_luminosity
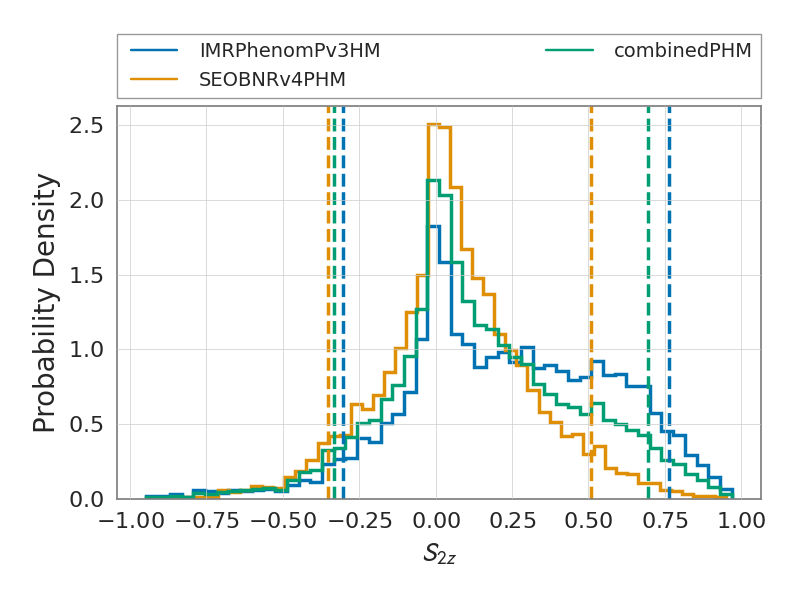
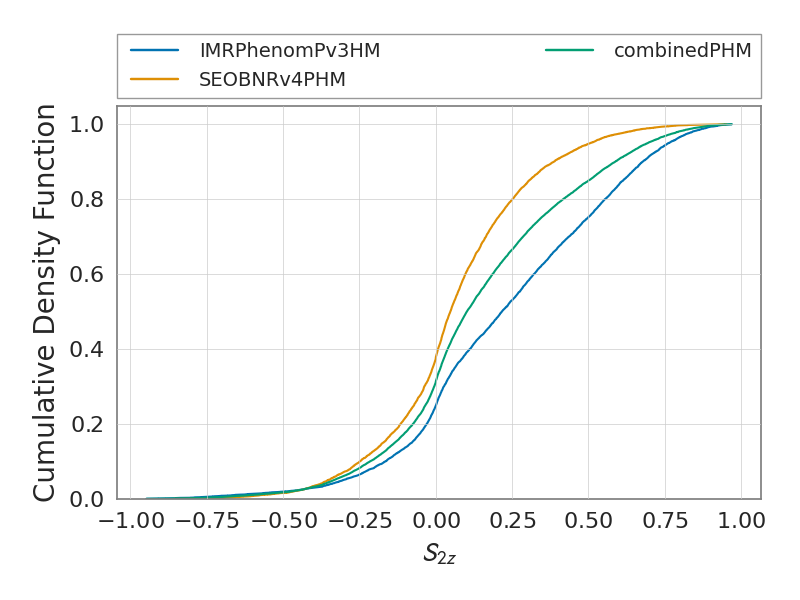
The figures below show the summary plots for the run
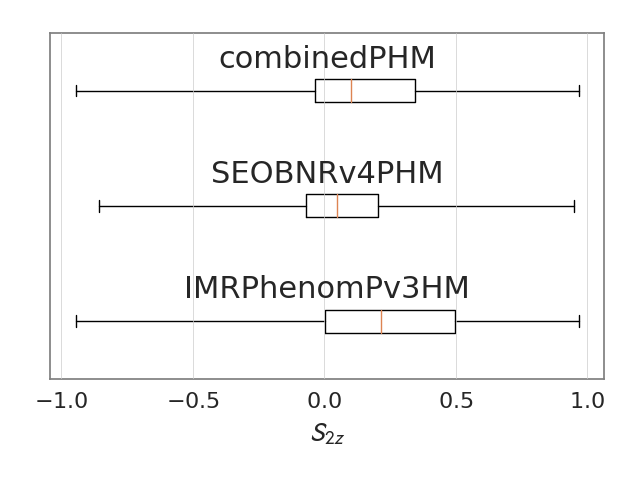
spin_2z
The figures below show the summary plots for the run
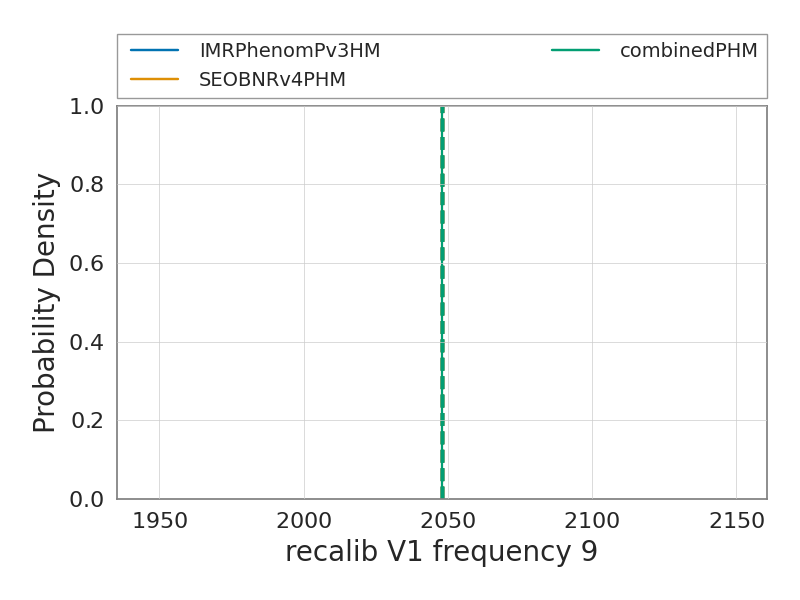
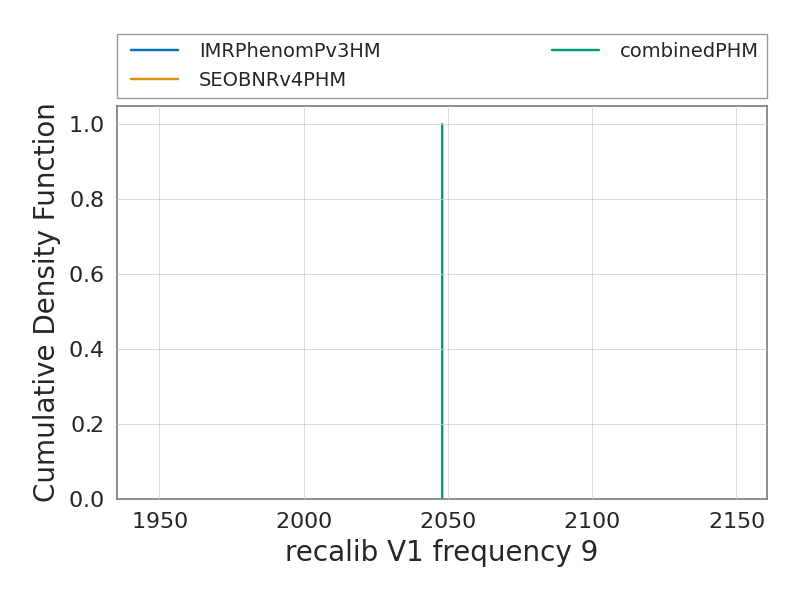
recalib_V1_frequency_9
The figures below show the summary plots for the run
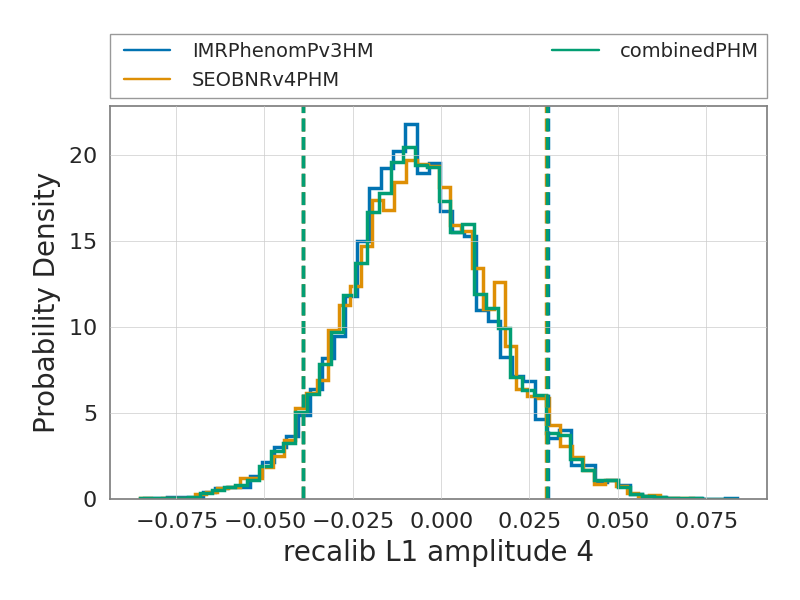
recalib_L1_amplitude_4
The figures below show the summary plots for the run
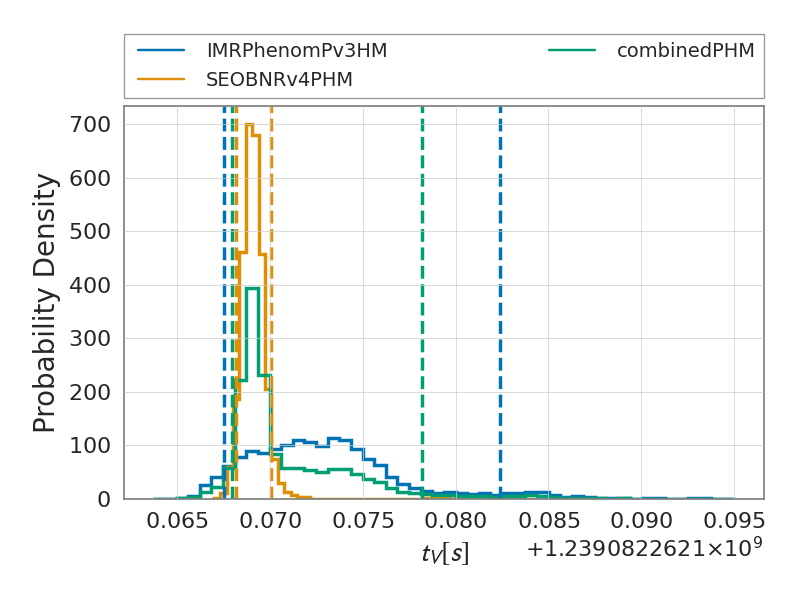
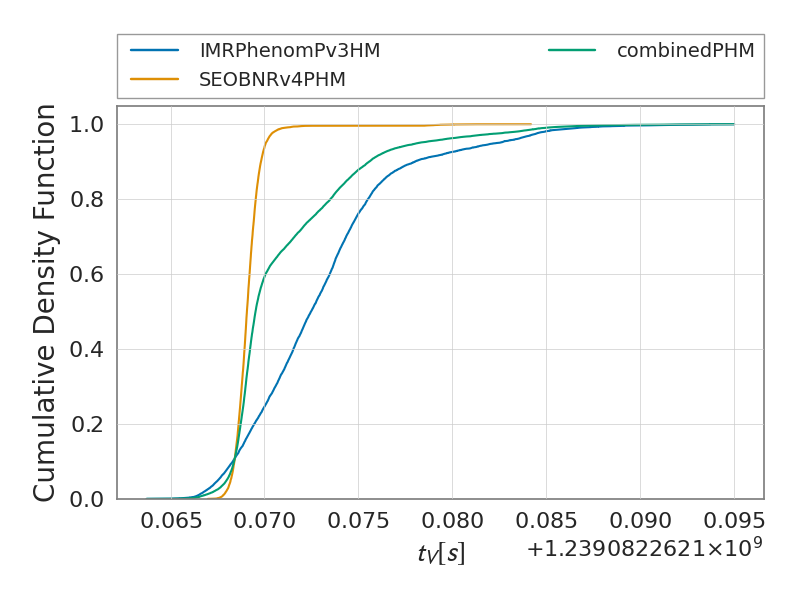
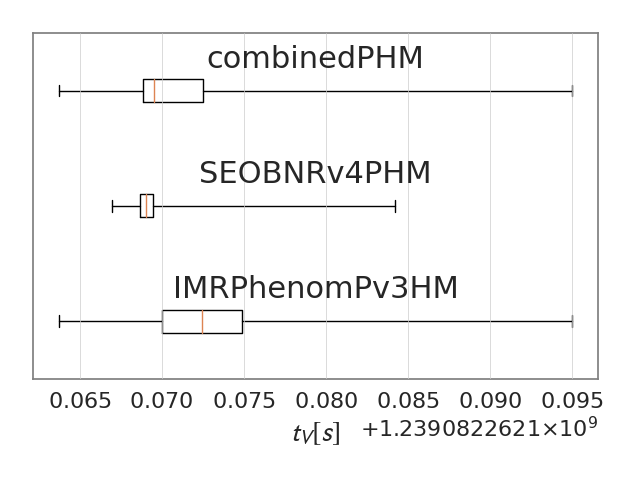
V1_time
The figures below show the summary plots for the run
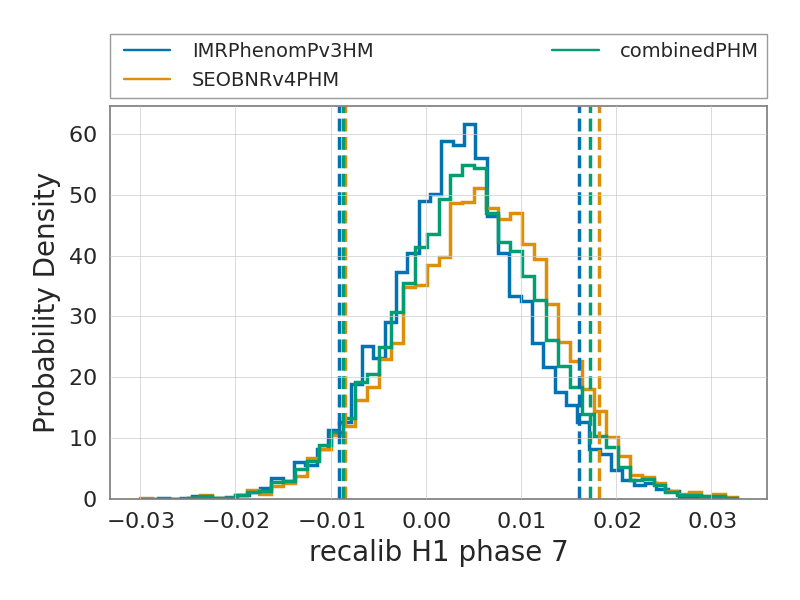
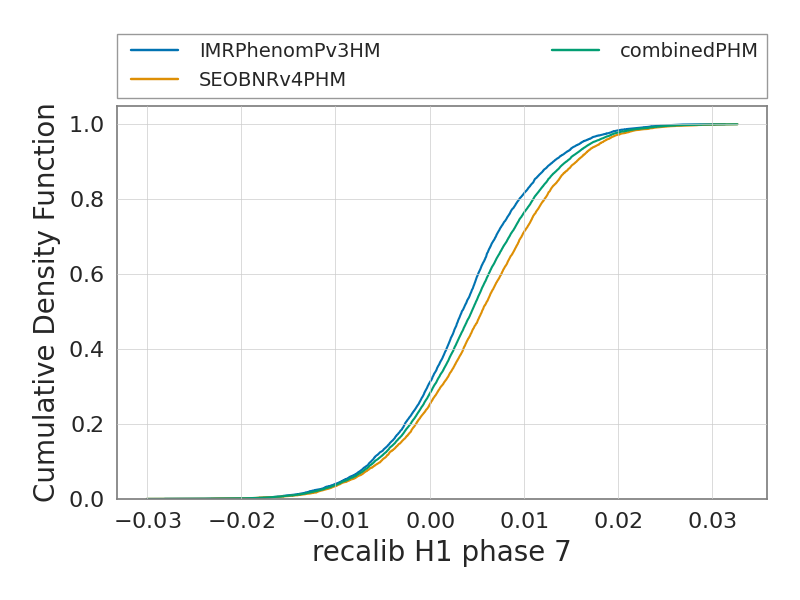
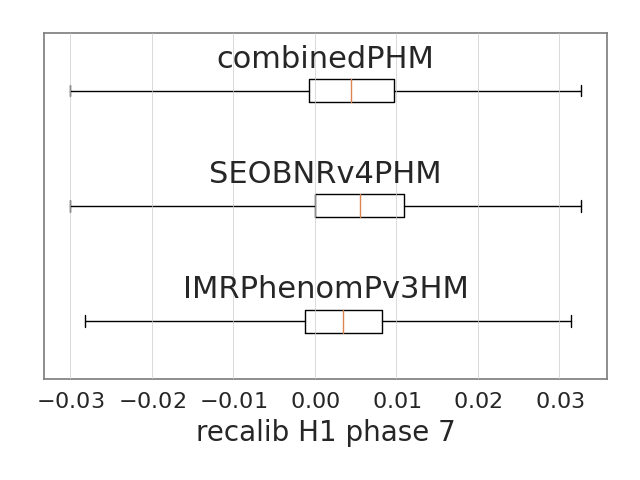
recalib_H1_phase_7
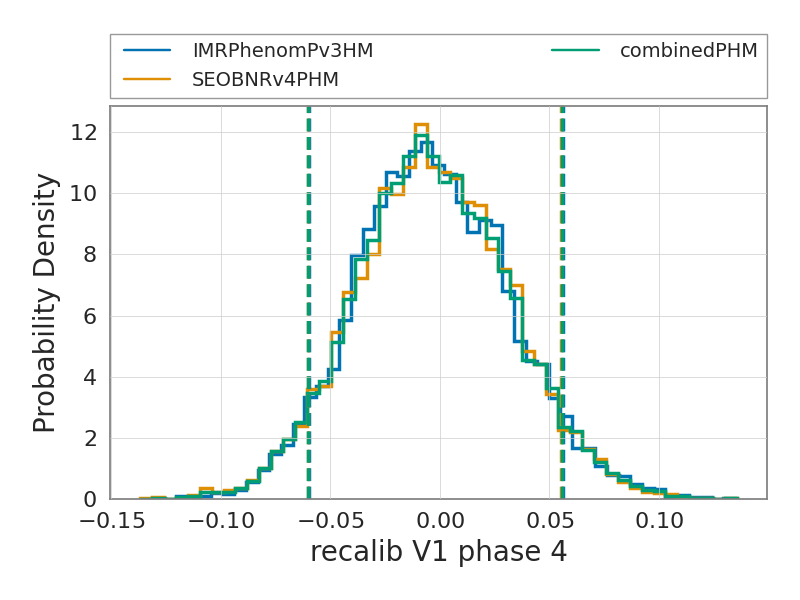
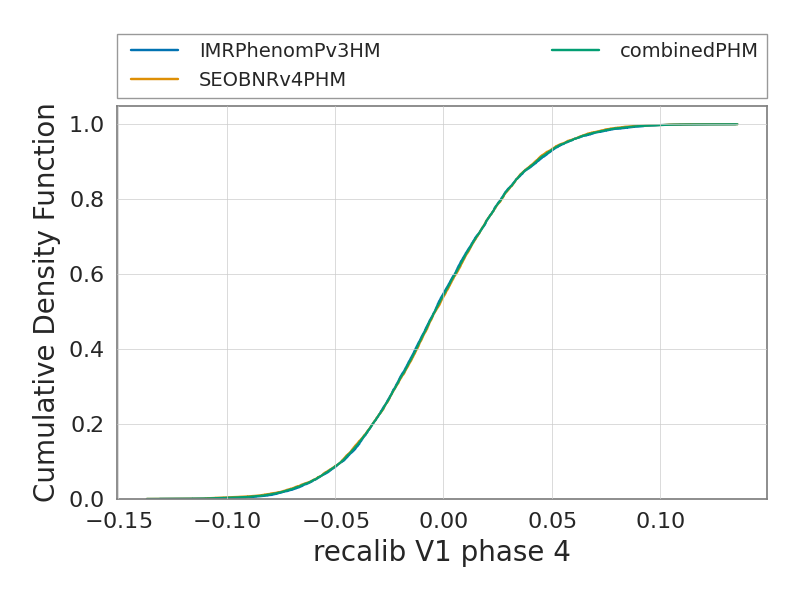
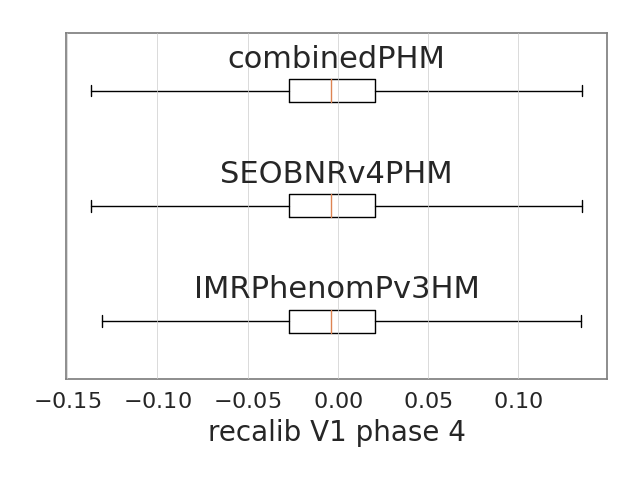
The figures below show the summary plots for the run
recalib_V1_phase_4
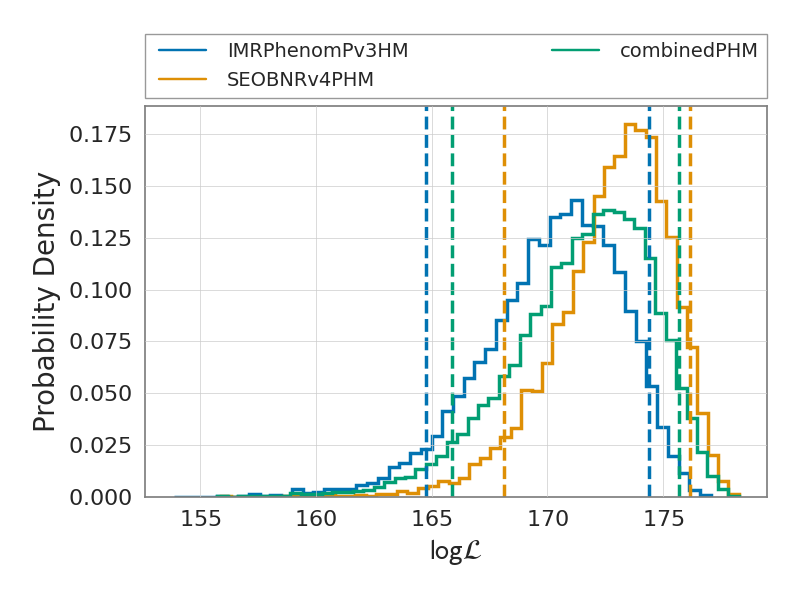
The figures below show the summary plots for the run
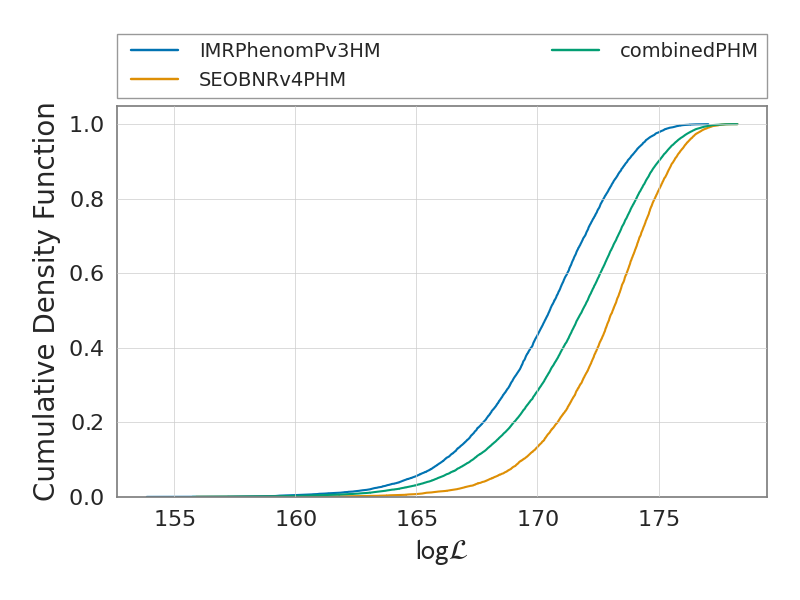
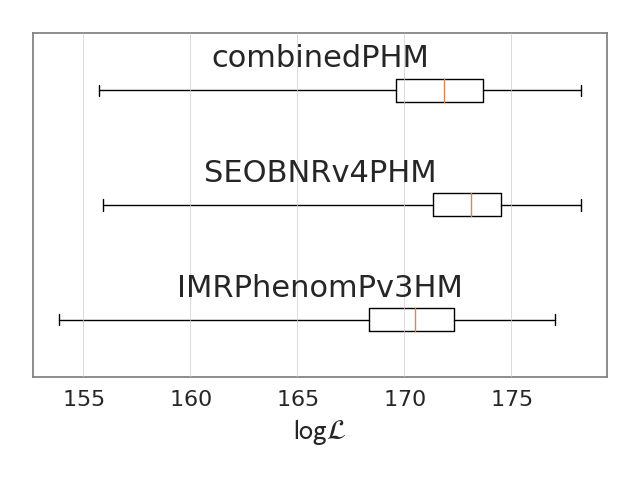
log_likelihood
The figures below show the summary plots for the run
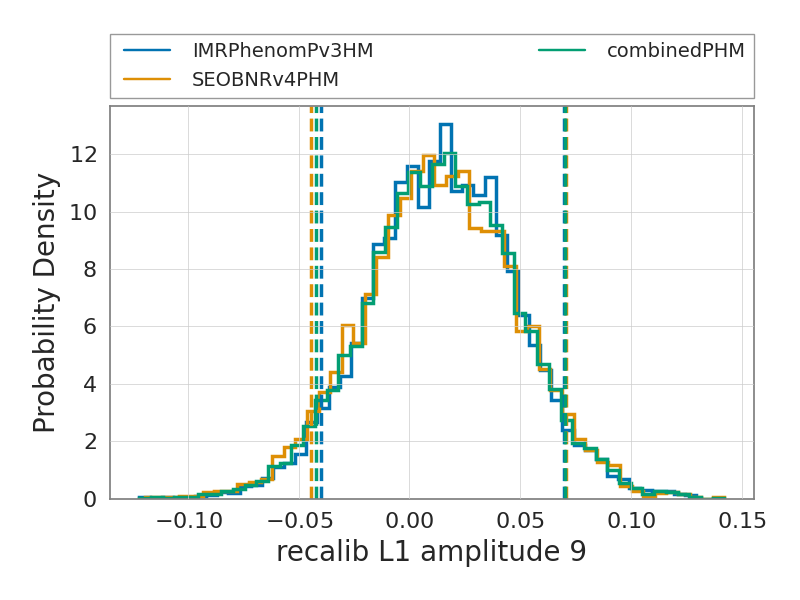
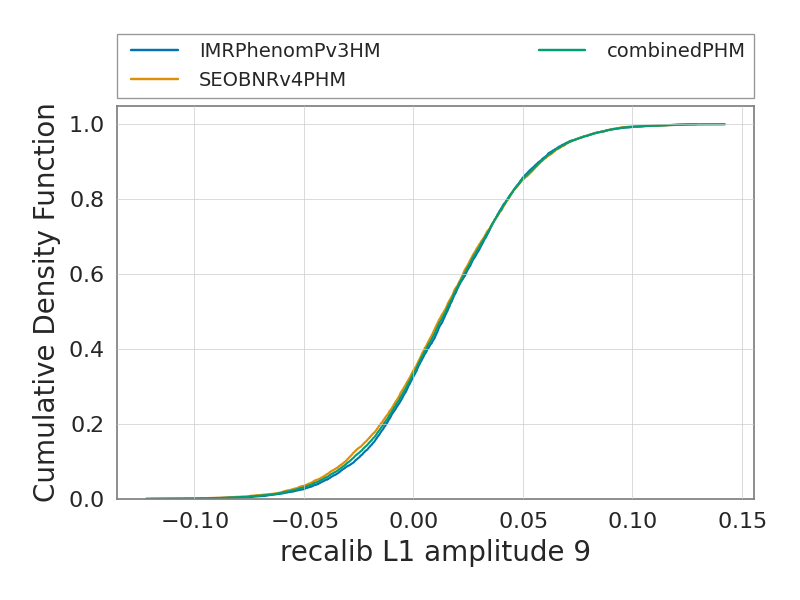
recalib_L1_amplitude_9
The figures below show the summary plots for the run
recalib_H1_amplitude_7
The figures below show the summary plots for the run
recalib_V1_phase_2
The figures below show the summary plots for the run
recalib_L1_frequency_3
The figures below show the summary plots for the run
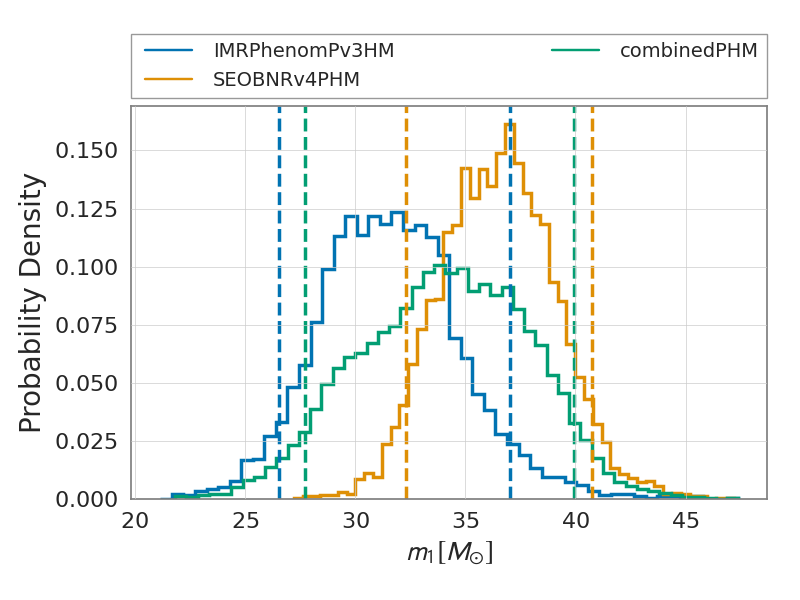
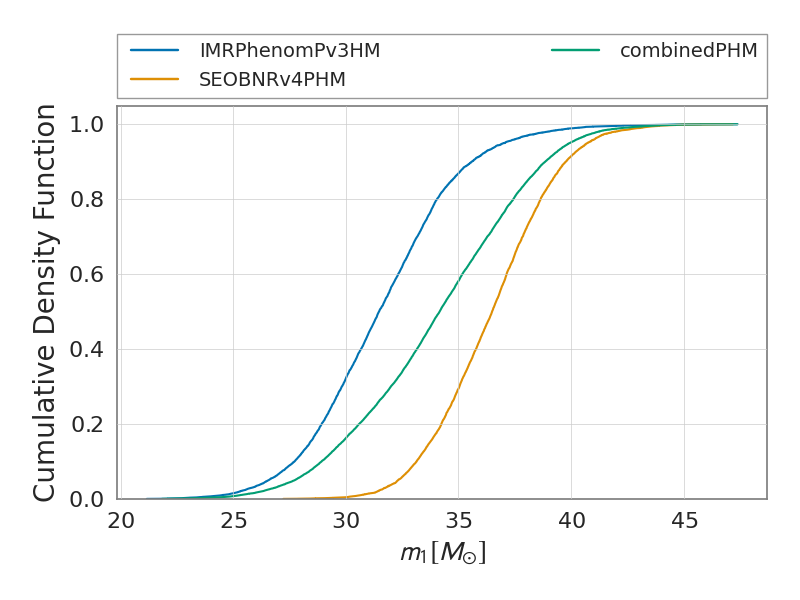
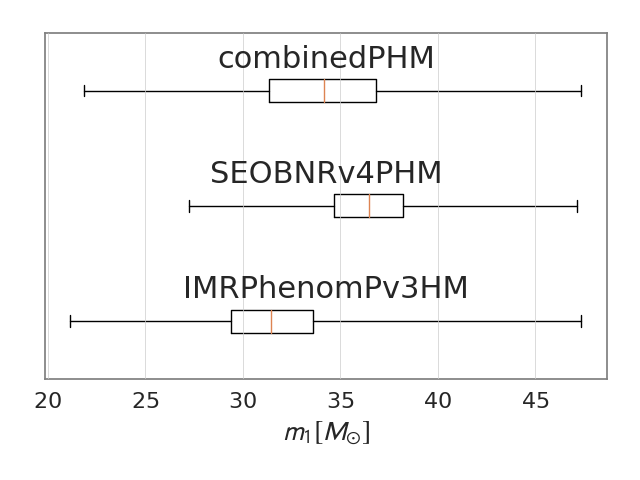
mass_1
The figures below show the summary plots for the run
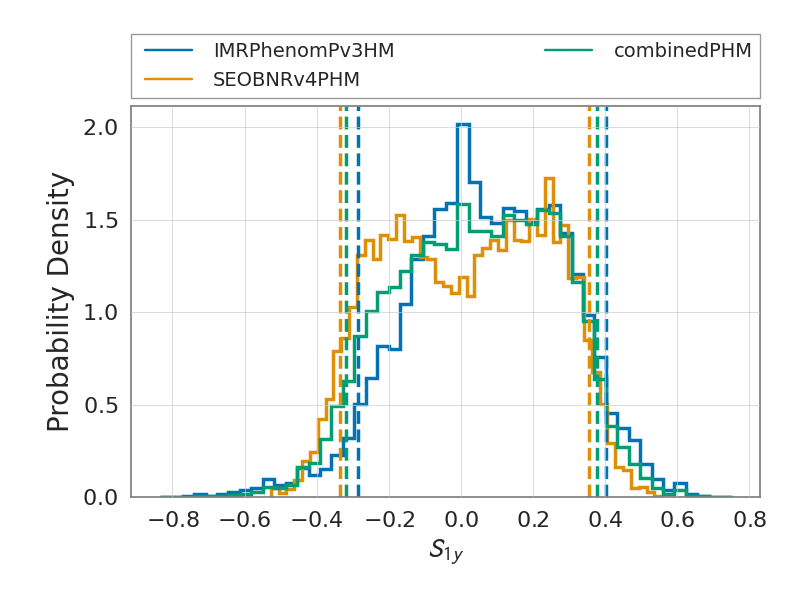
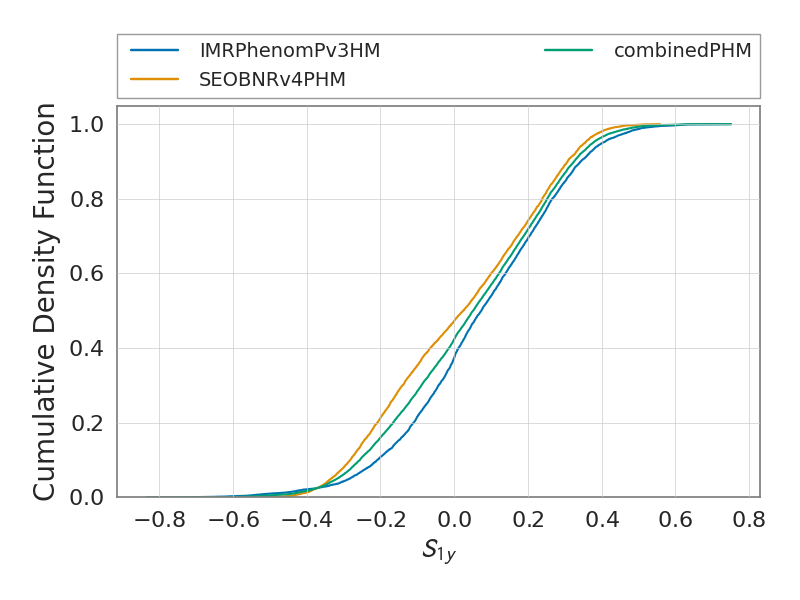
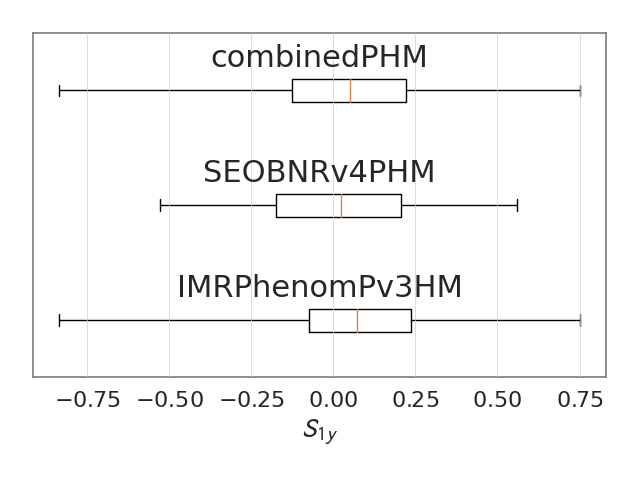
spin_1y
The figures below show the summary plots for the run
recalib_L1_amplitude_2
The figures below show the summary plots for the run
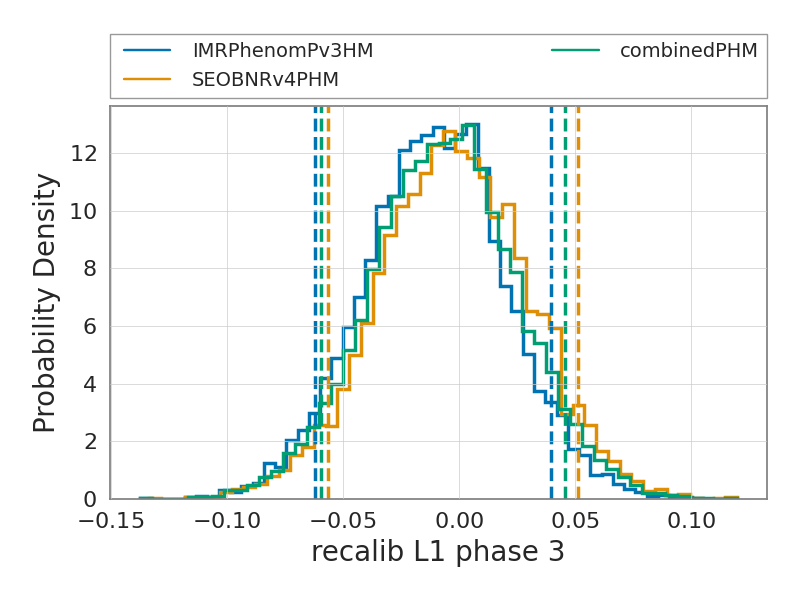
recalib_L1_phase_3
The figures below show the summary plots for the run
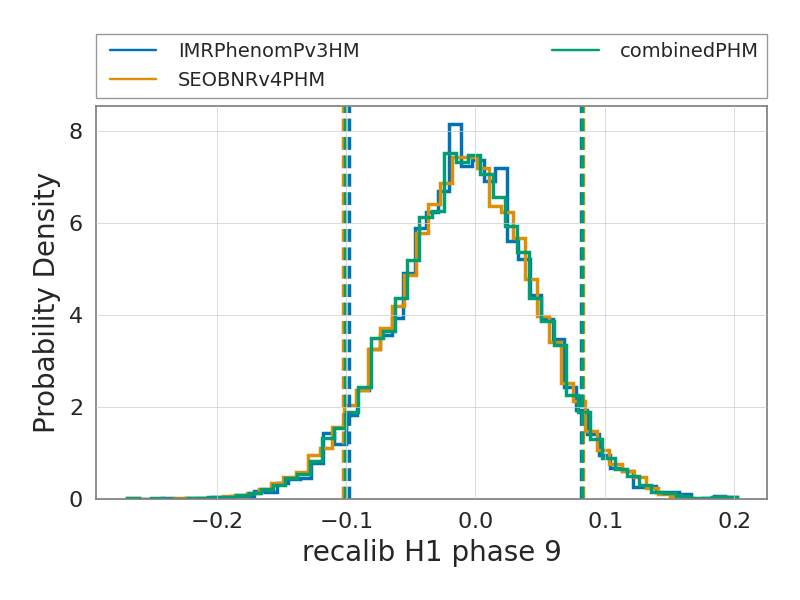
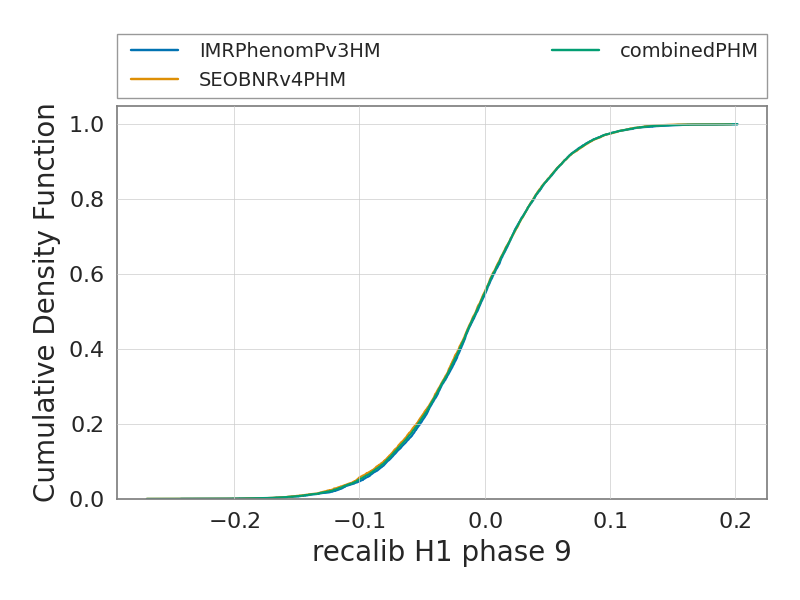
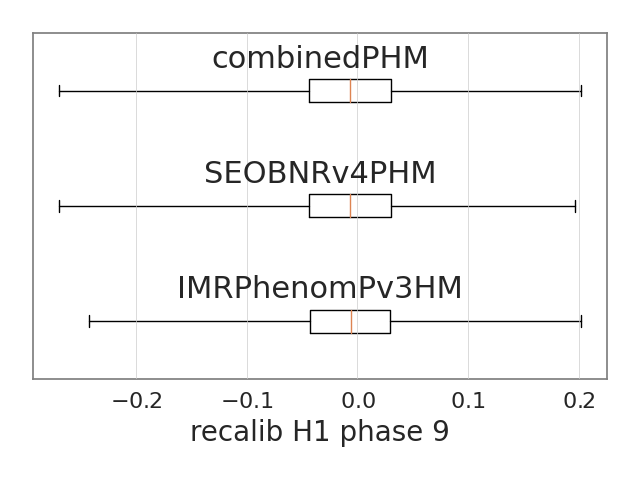
recalib_H1_phase_9
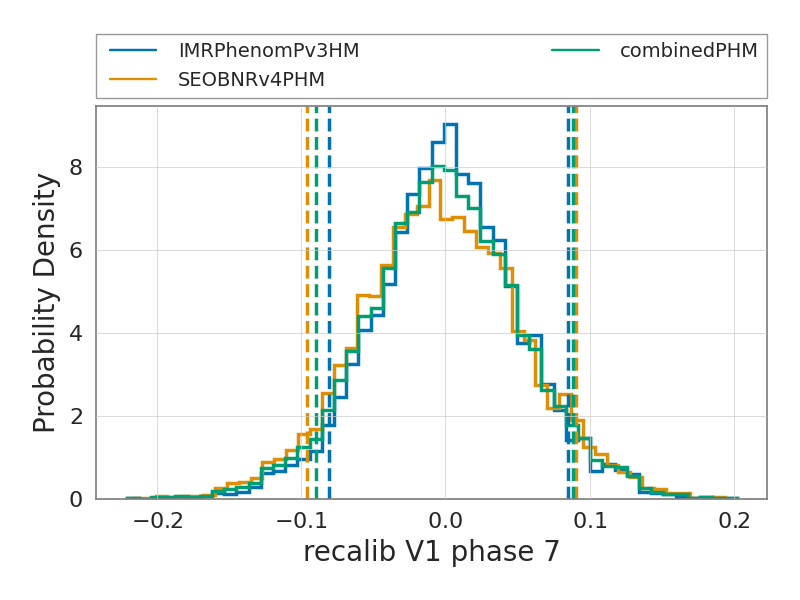
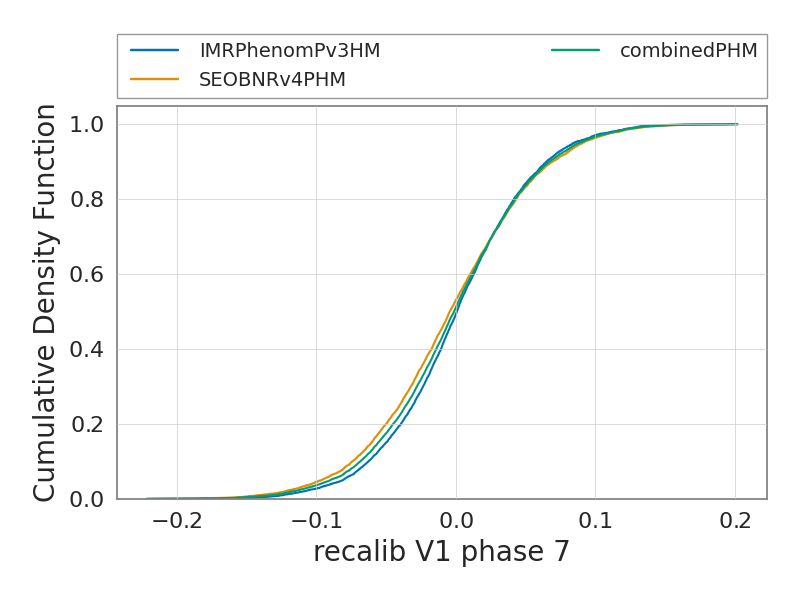
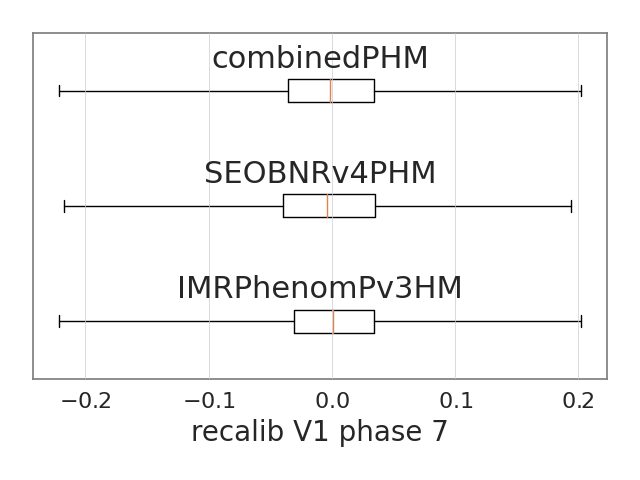
The figures below show the summary plots for the run
recalib_V1_phase_7
The figures below show the summary plots for the run
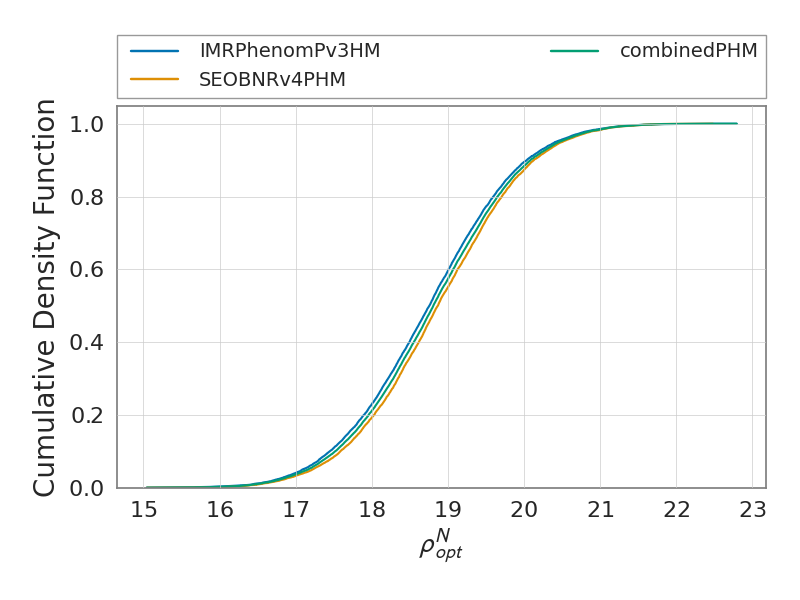
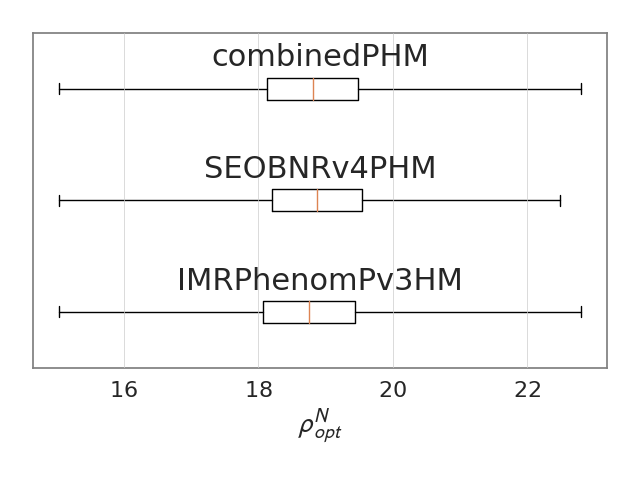
network_optimal_snr
The figures below show the summary plots for the run
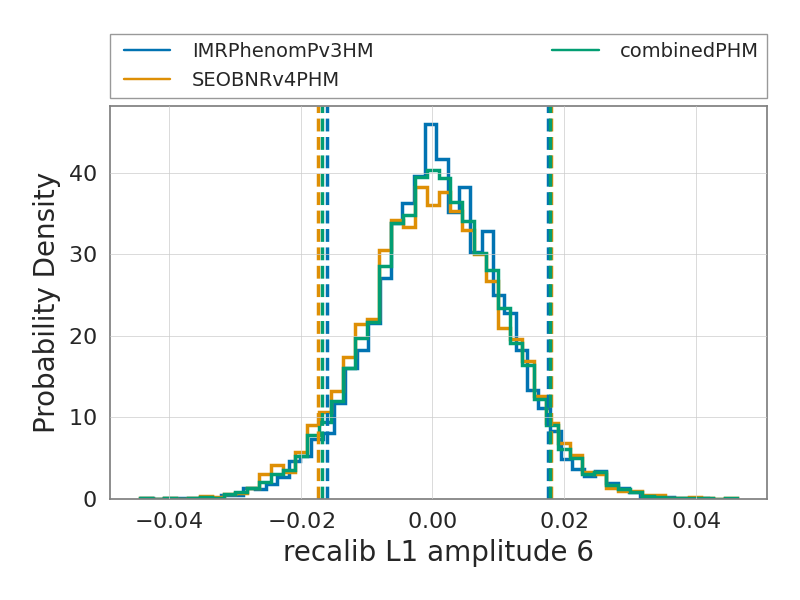
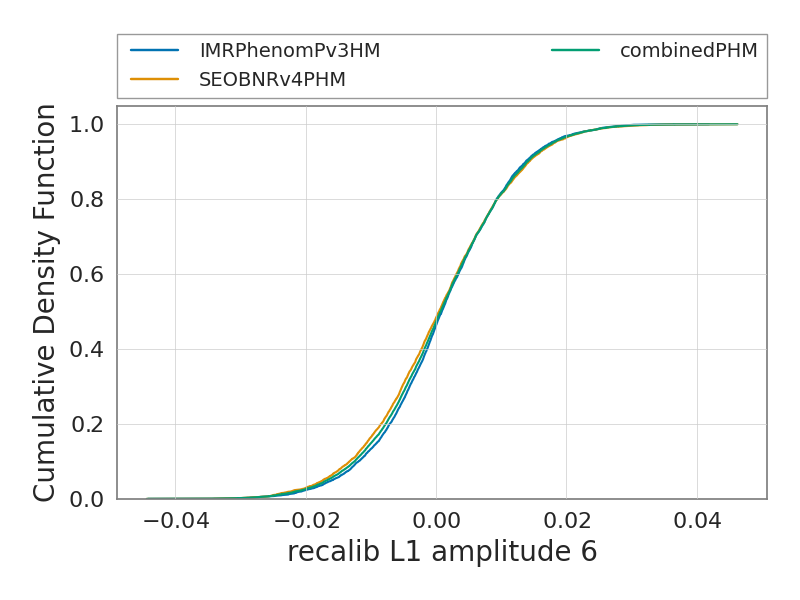
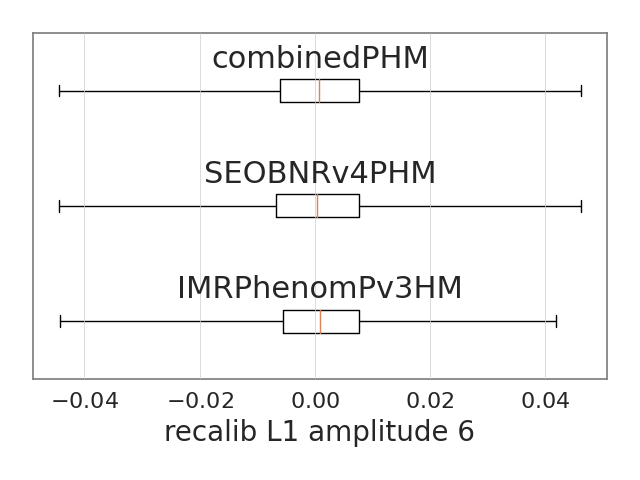
recalib_L1_amplitude_6
The figures below show the summary plots for the run
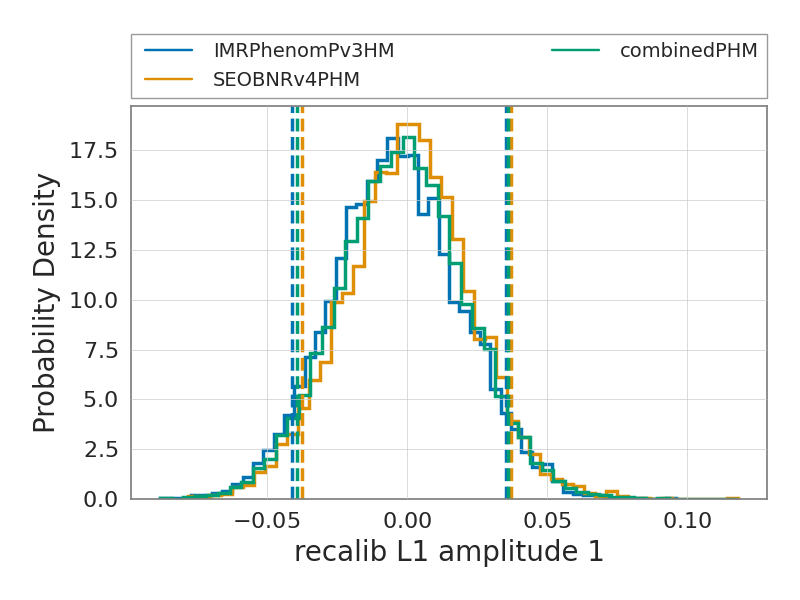
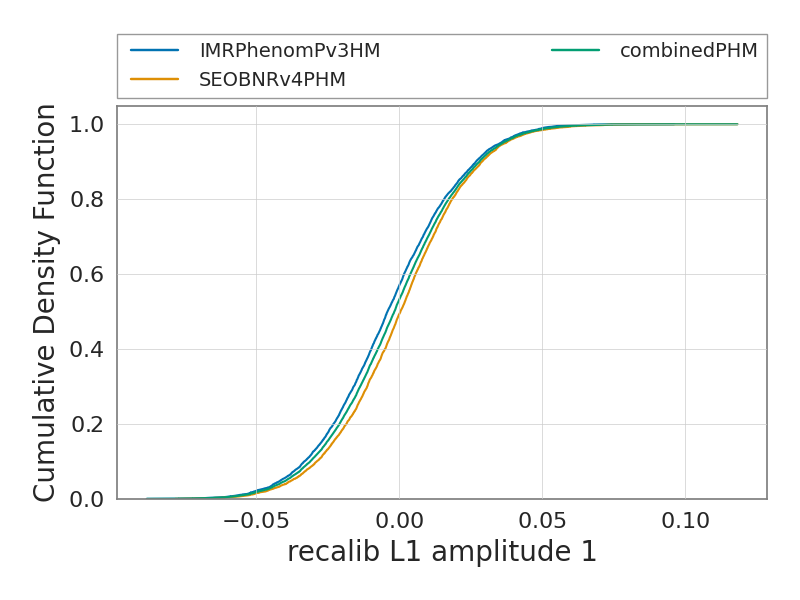
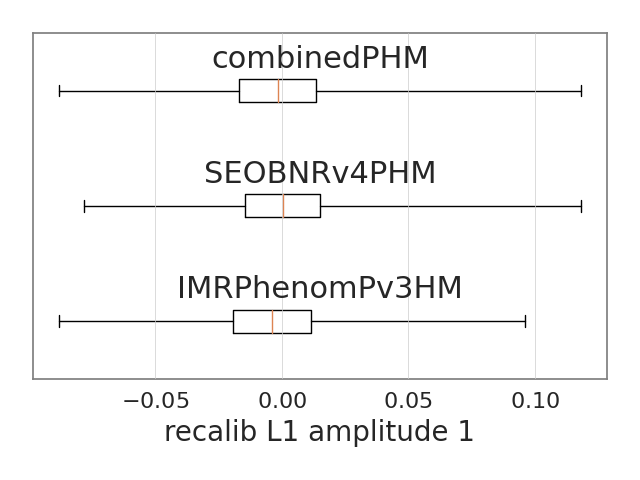
recalib_L1_amplitude_1
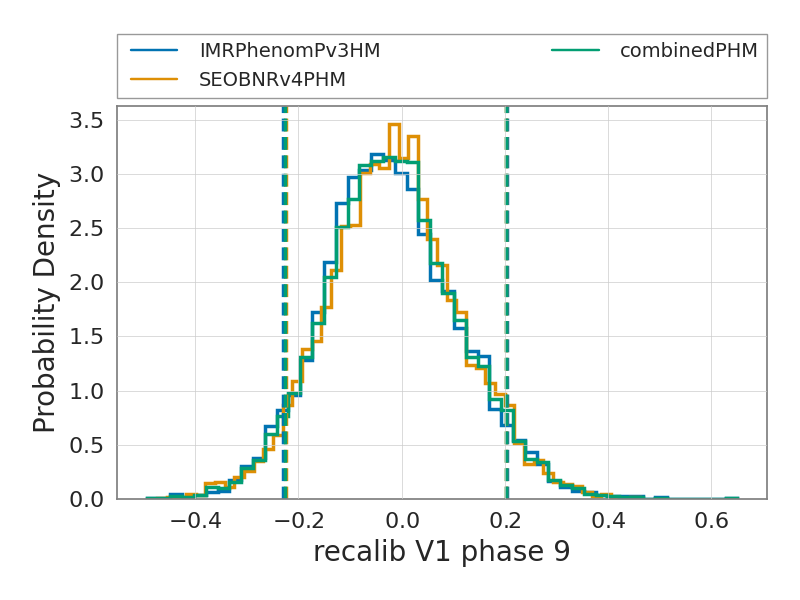
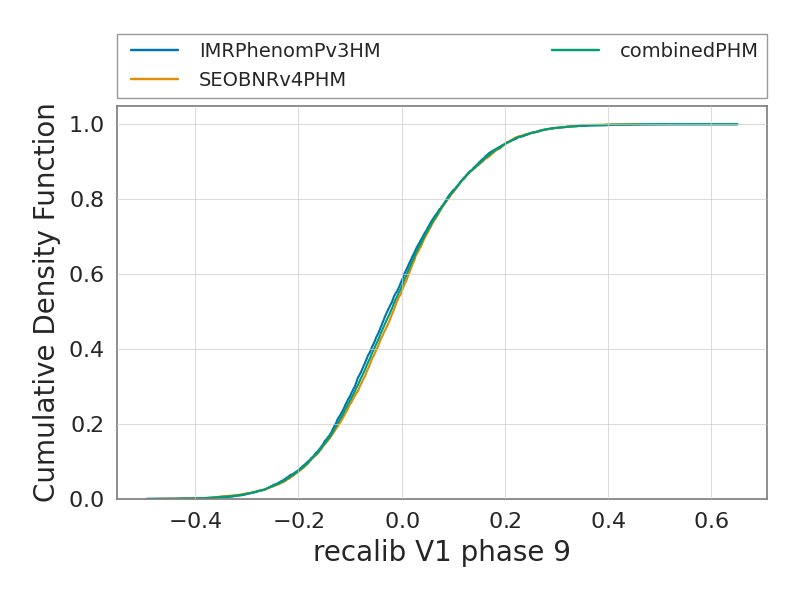
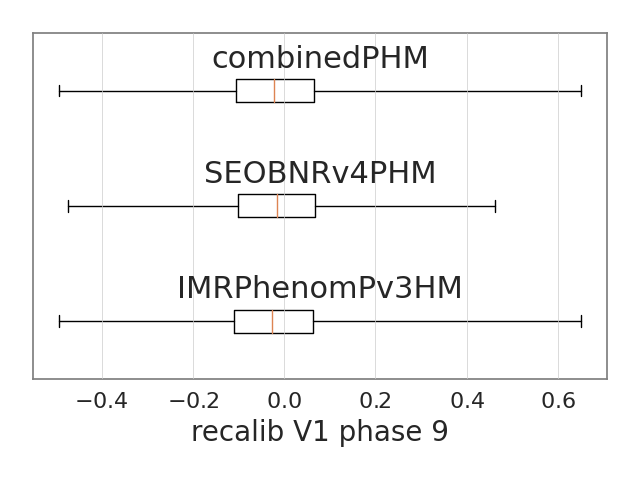
The figures below show the summary plots for the run
recalib_V1_phase_9
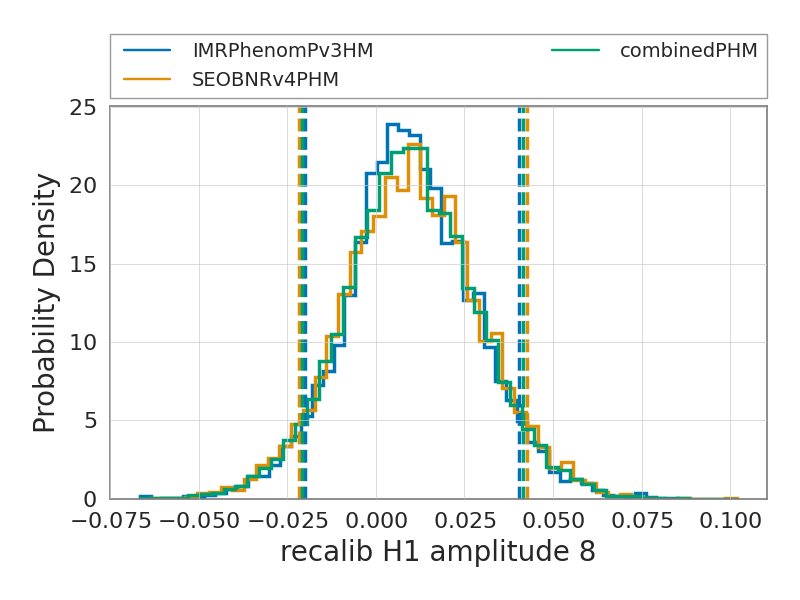
The figures below show the summary plots for the run
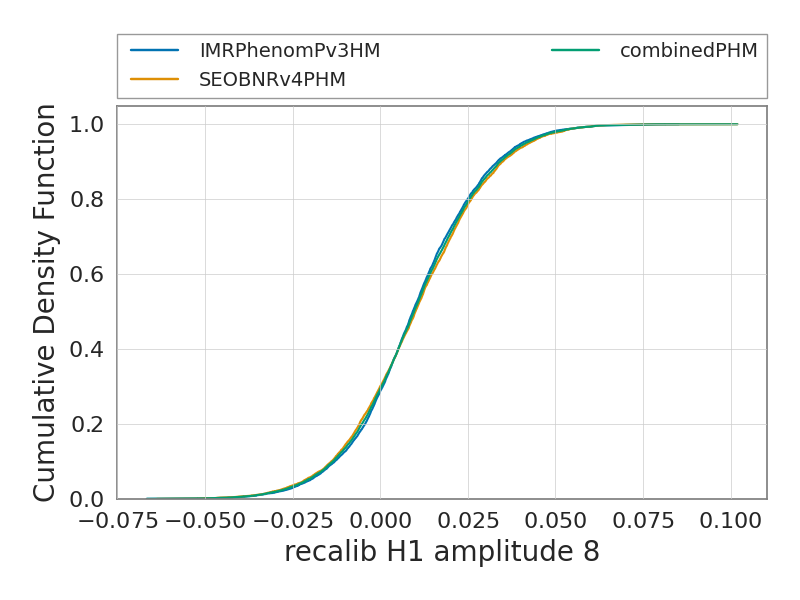
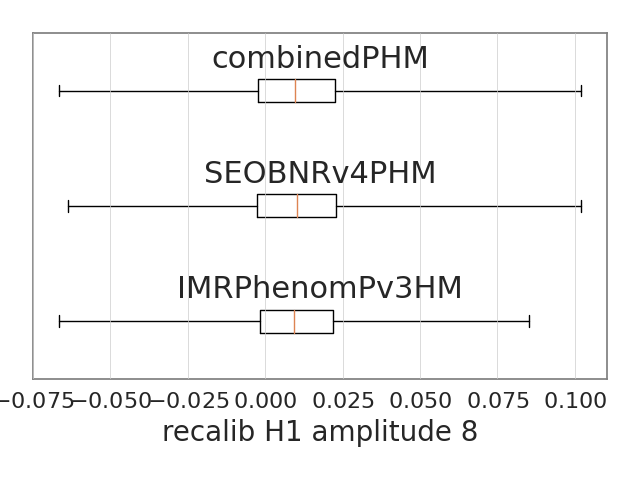
recalib_H1_amplitude_8
The figures below show the summary plots for the run
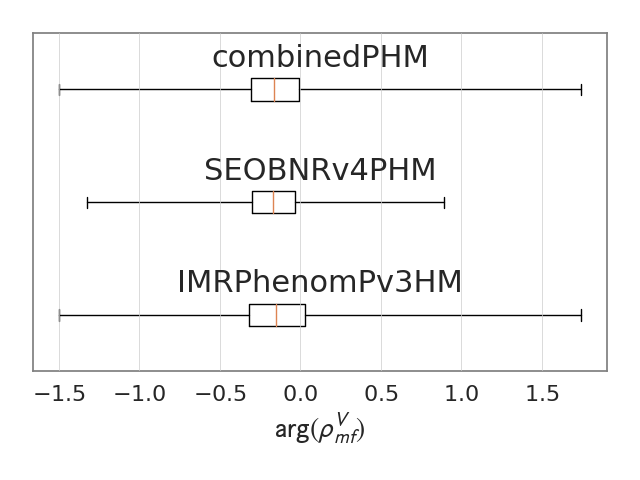
V1_matched_filter_snr_angle
The figures below show the summary plots for the run
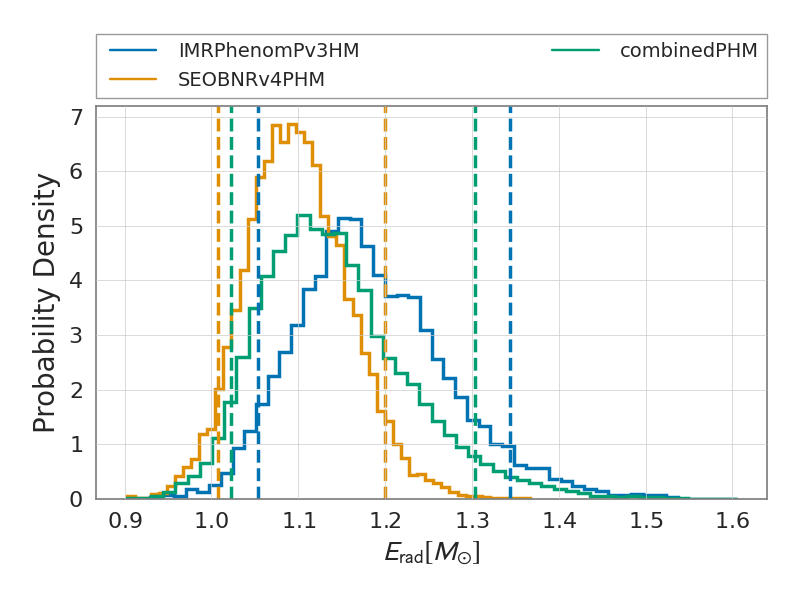
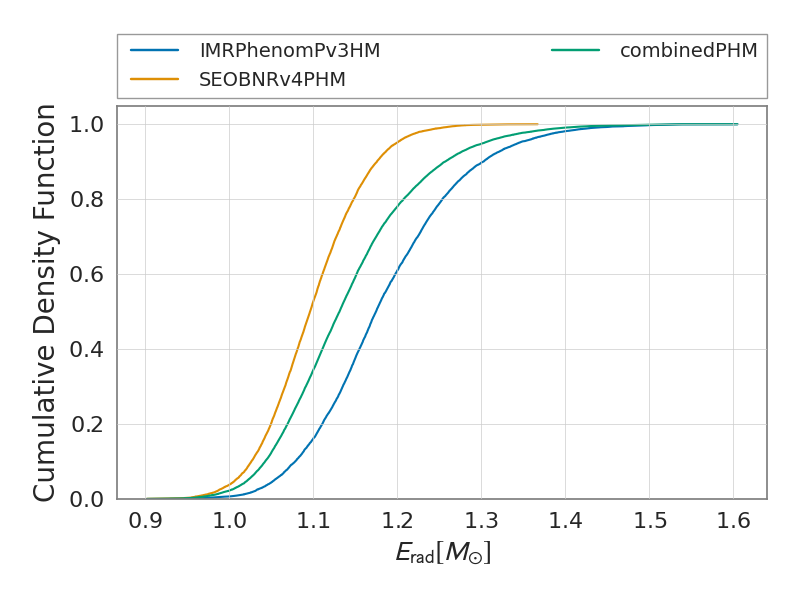
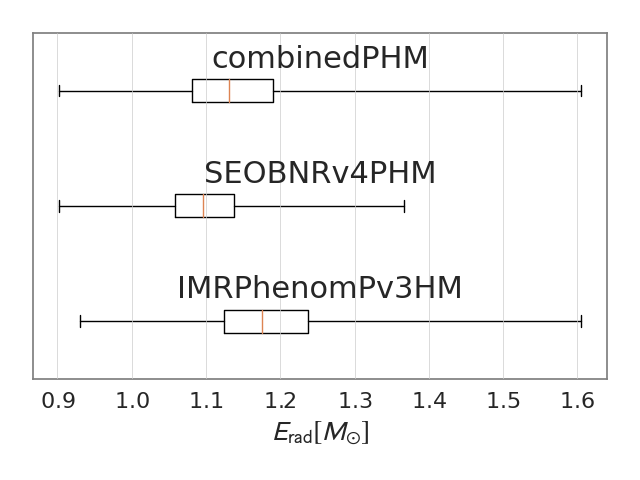
radiated_energy
The figures below show the summary plots for the run
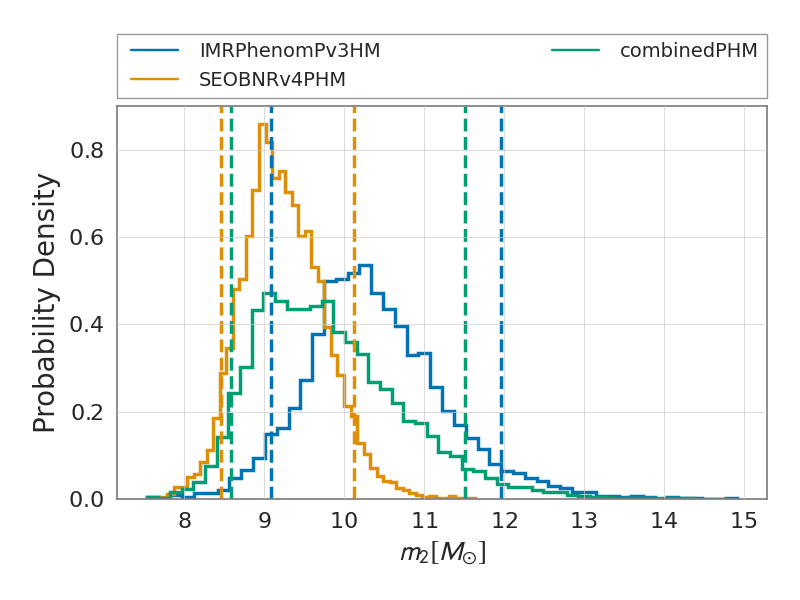
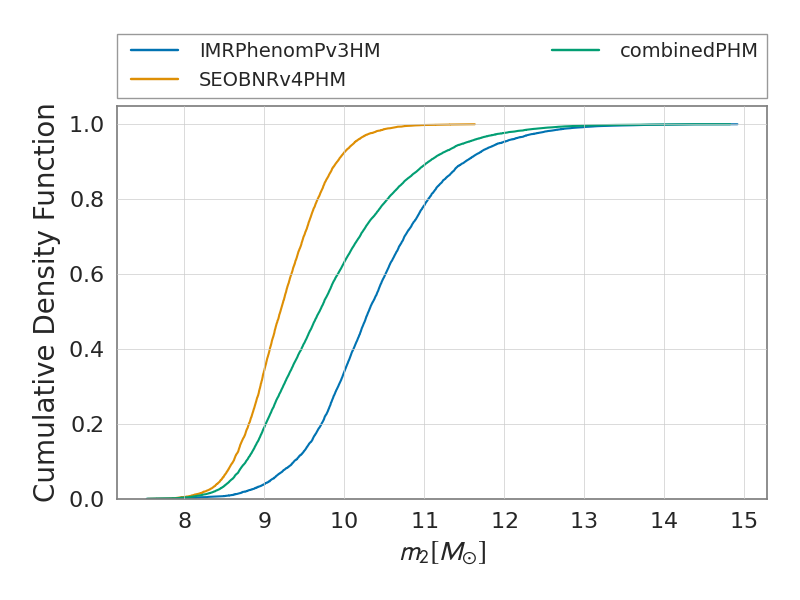
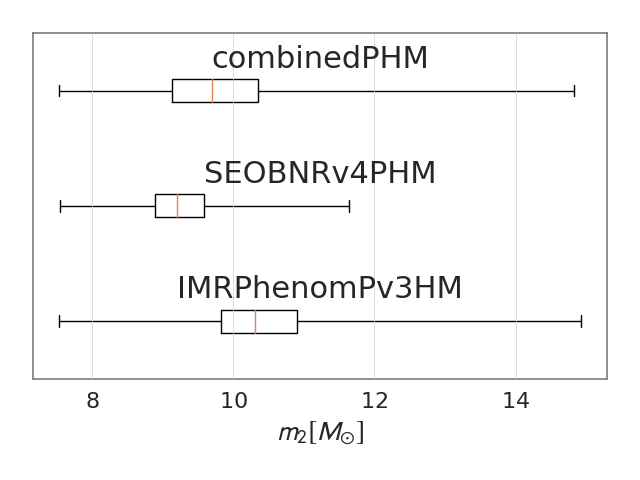
mass_2
The figures below show the summary plots for the run
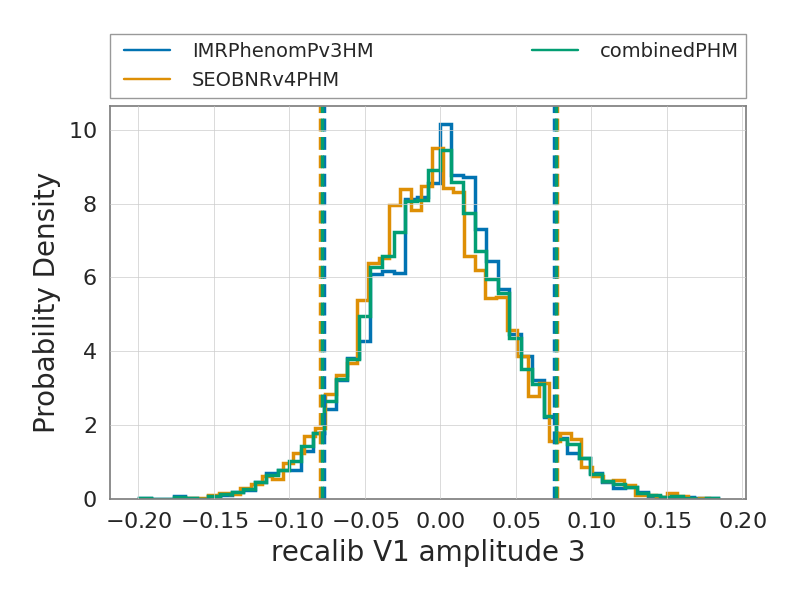
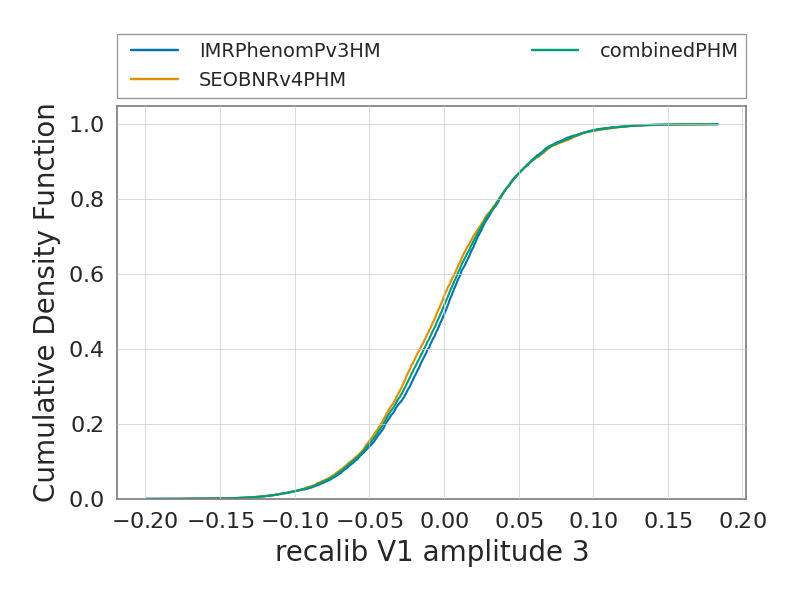
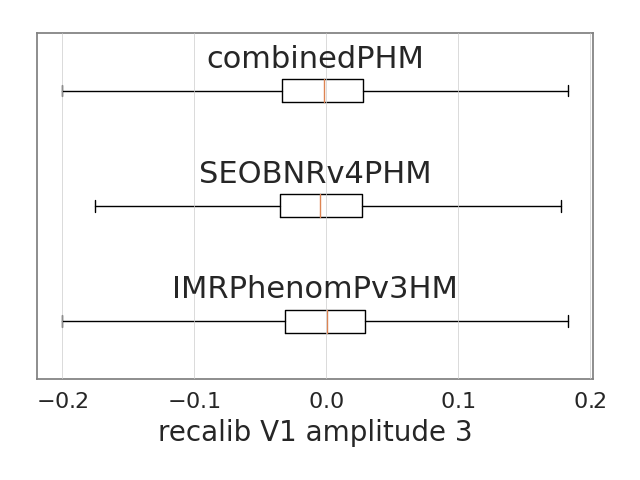
recalib_V1_amplitude_3
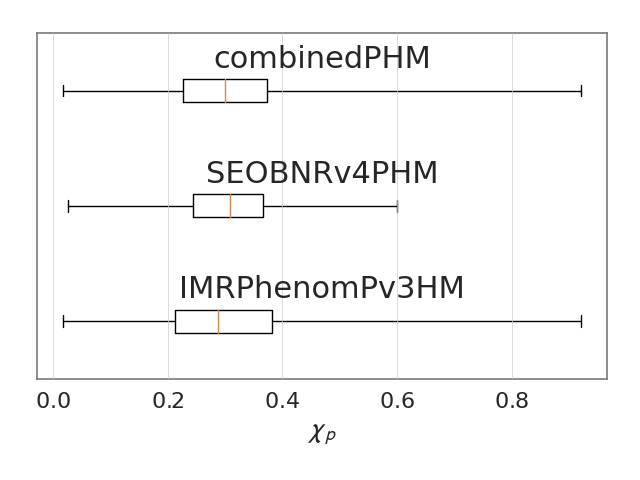
The figures below show the summary plots for the run
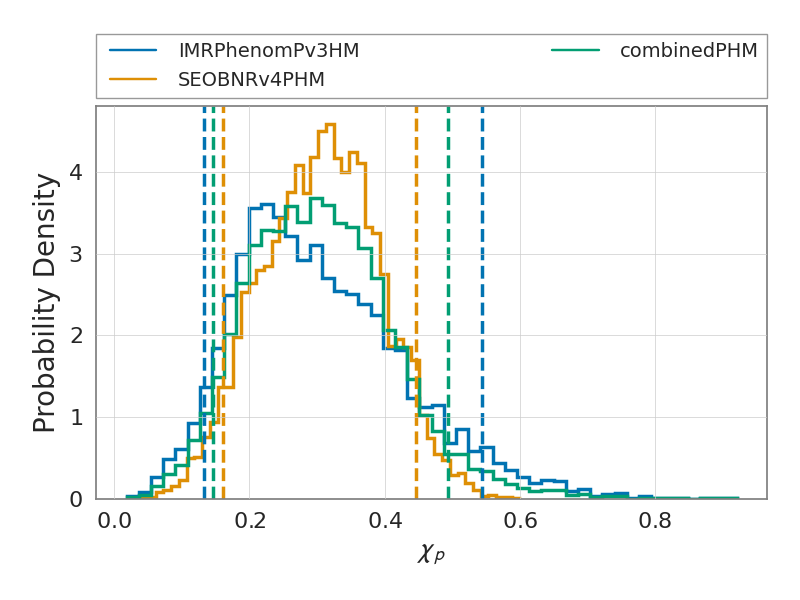
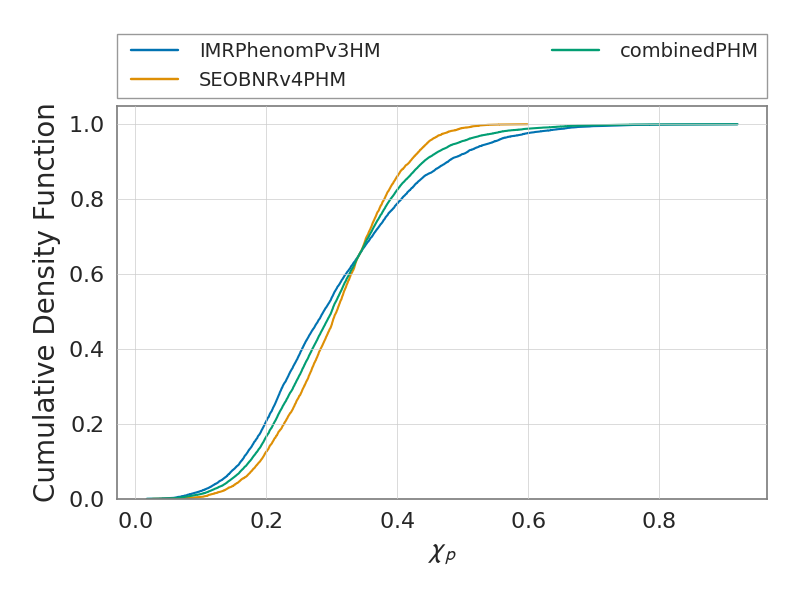
chi_p
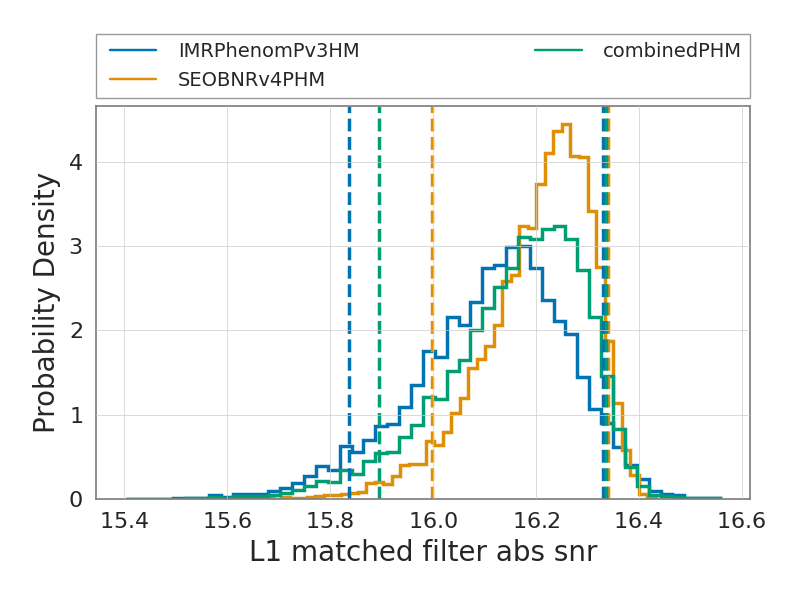
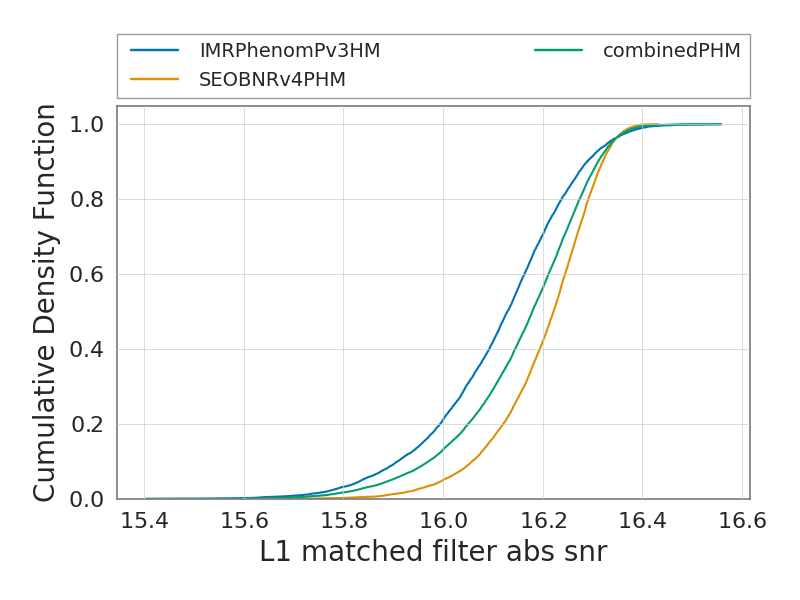
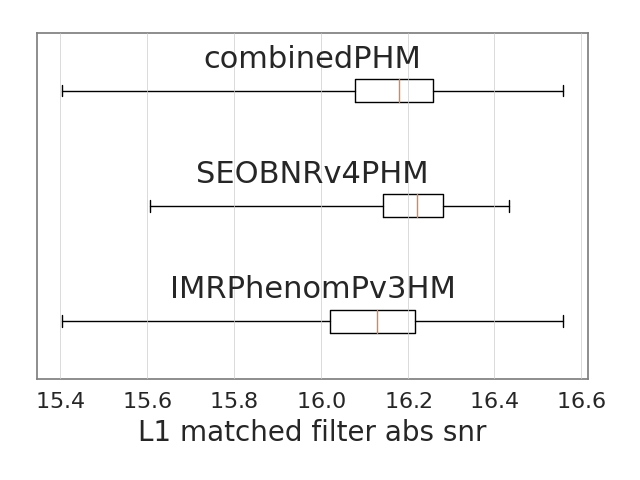
The figures below show the summary plots for the run
L1_matched_filter_abs_snr
The figures below show the summary plots for the run
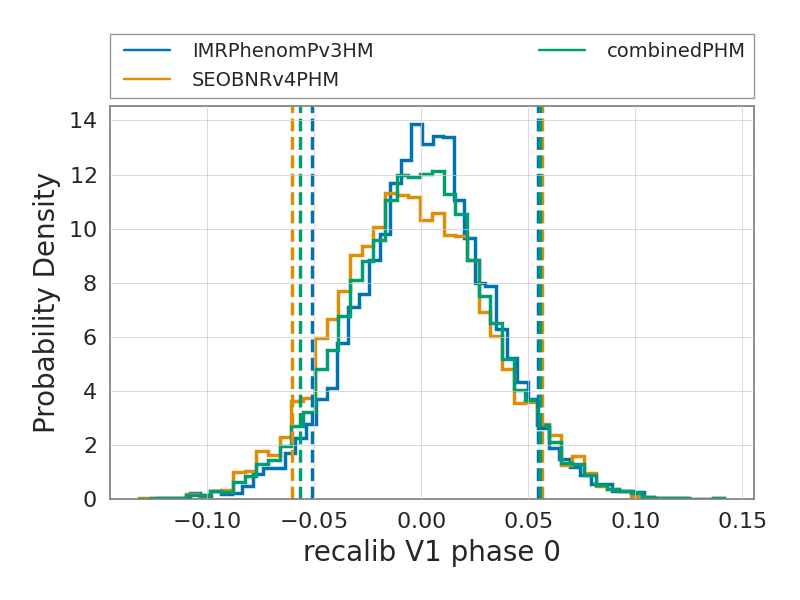
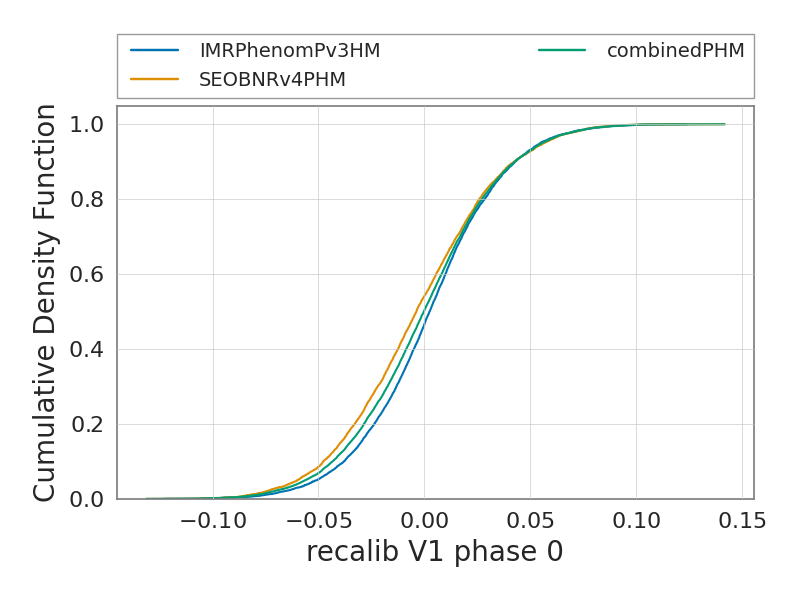
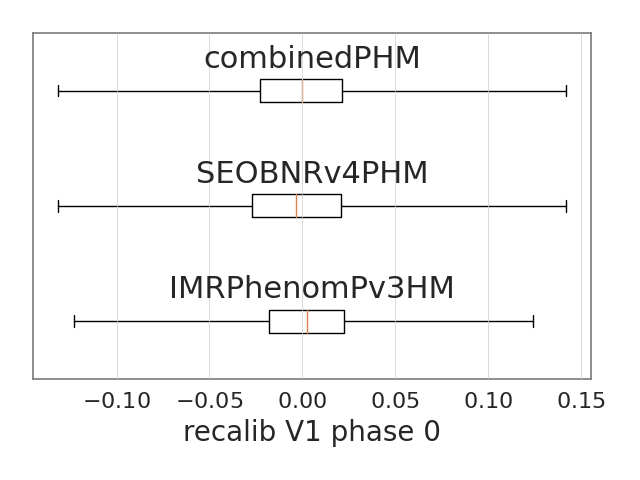
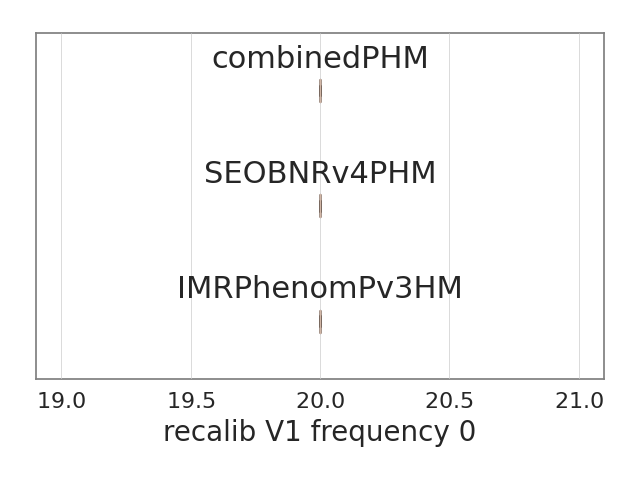
recalib_V1_phase_0
The figures below show the summary plots for the run
recalib_V1_frequency_0
The figures below show the summary plots for the run
recalib_V1_phase_6
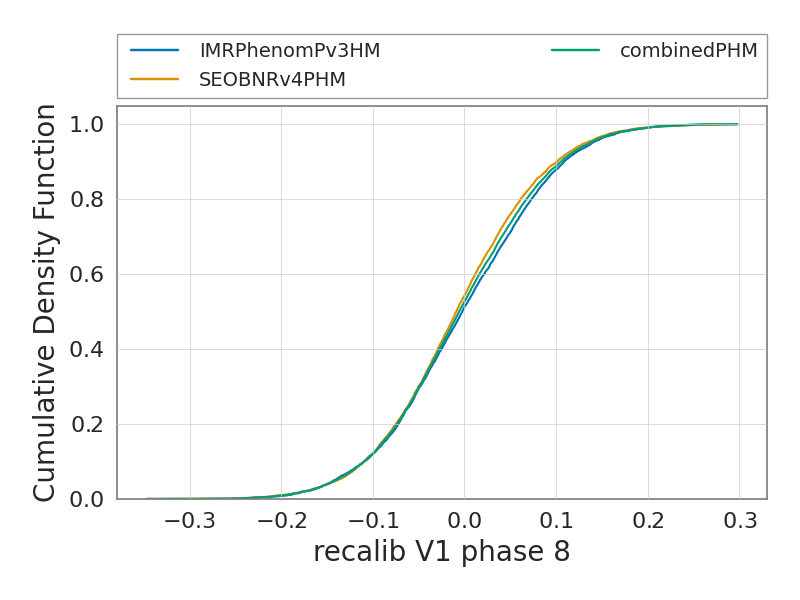
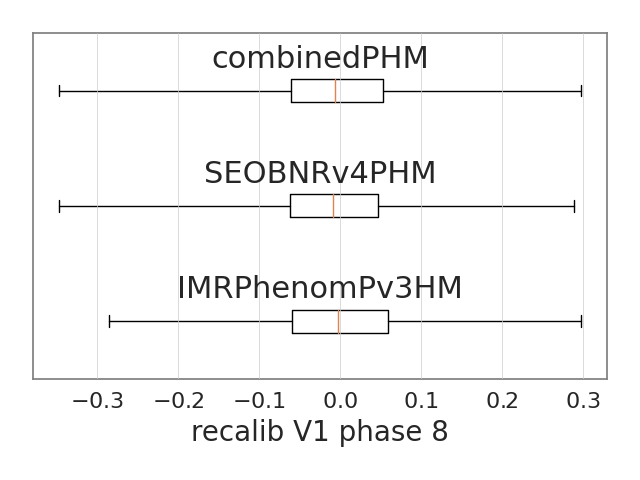
The figures below show the summary plots for the run
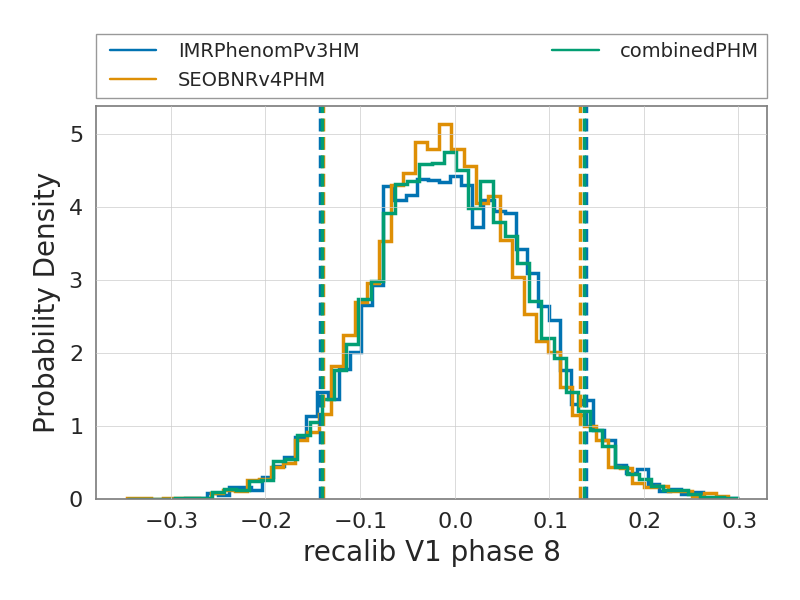
recalib_V1_phase_8
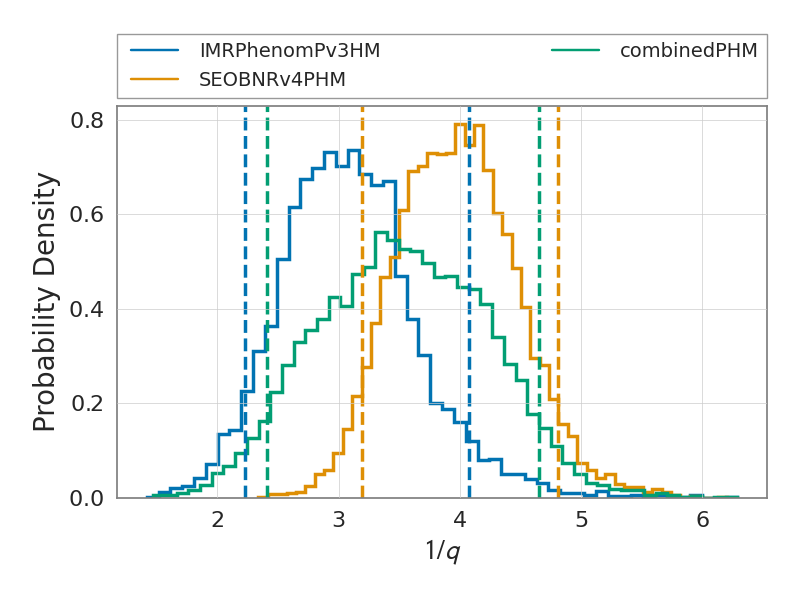
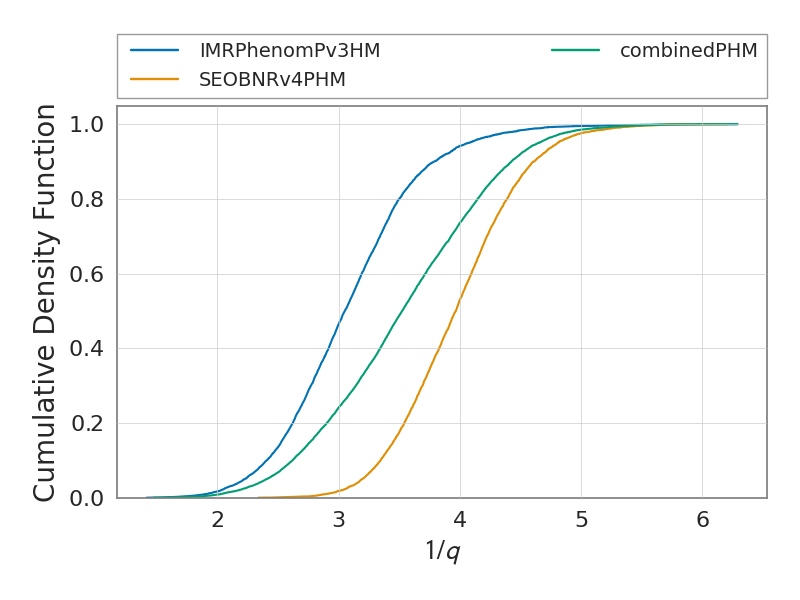
The figures below show the summary plots for the run
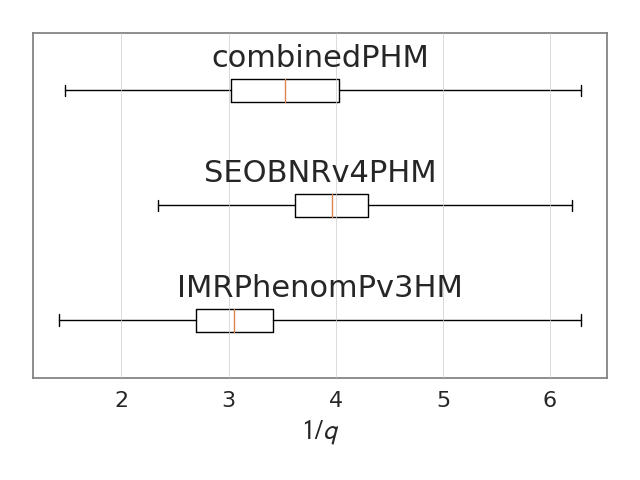
inverted_mass_ratio
The figures below show the summary plots for the run
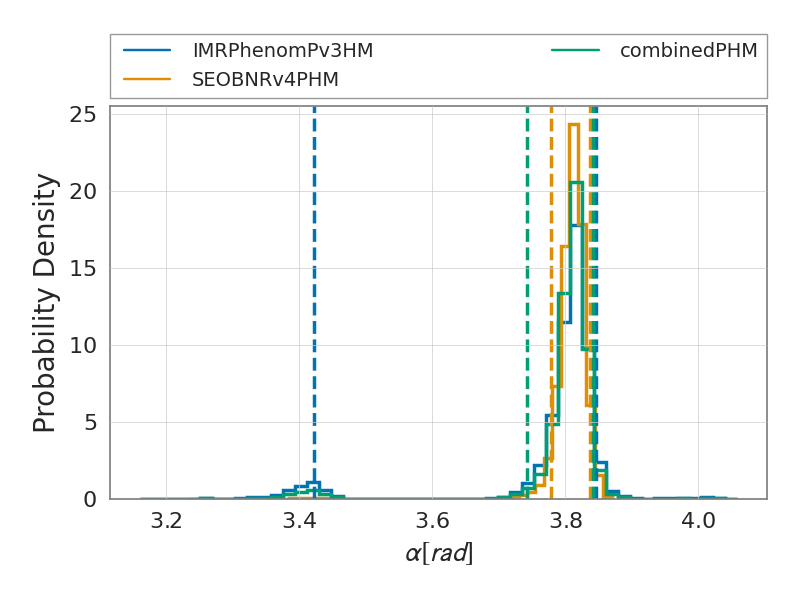
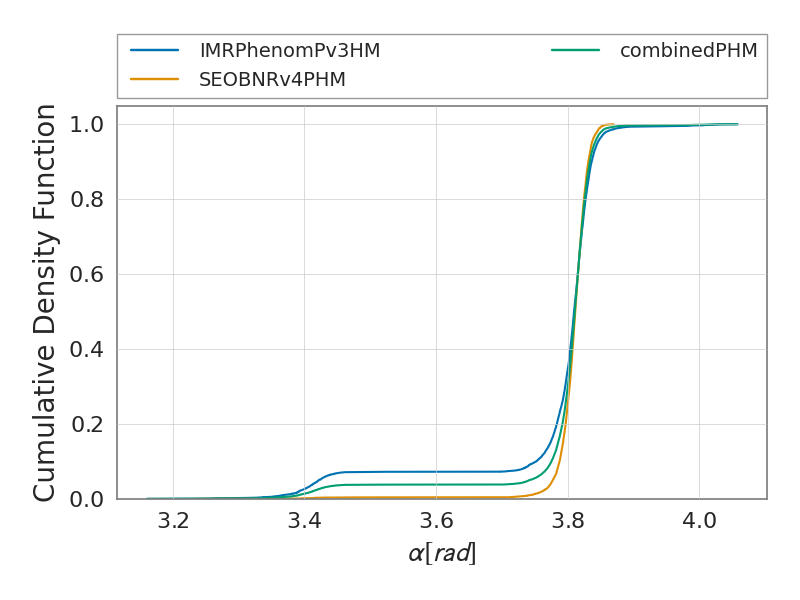
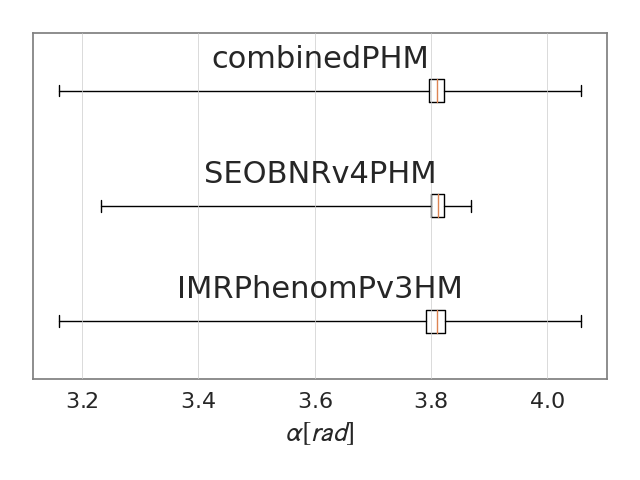
ra
The figures below show the summary plots for the run
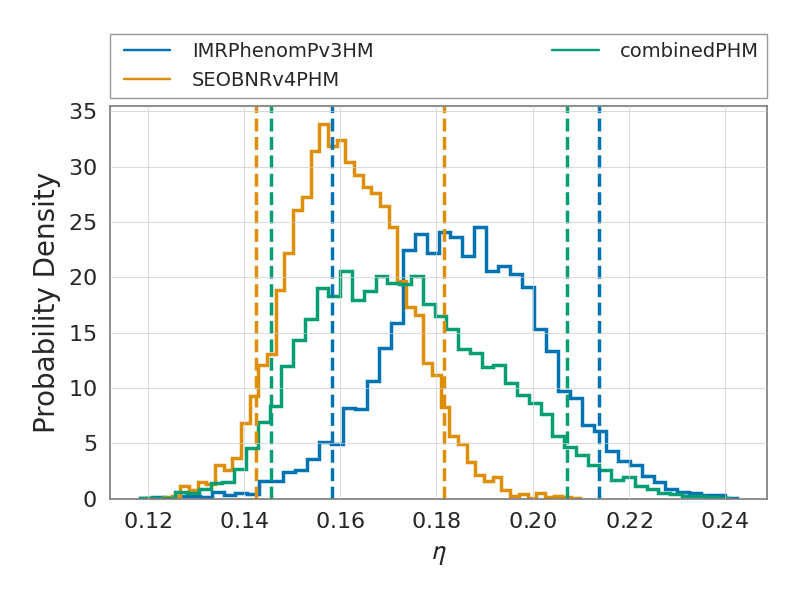
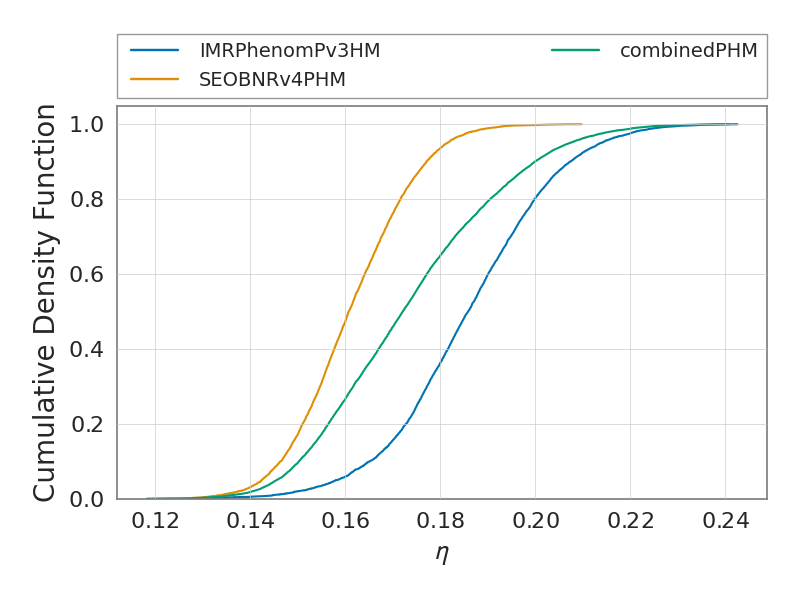
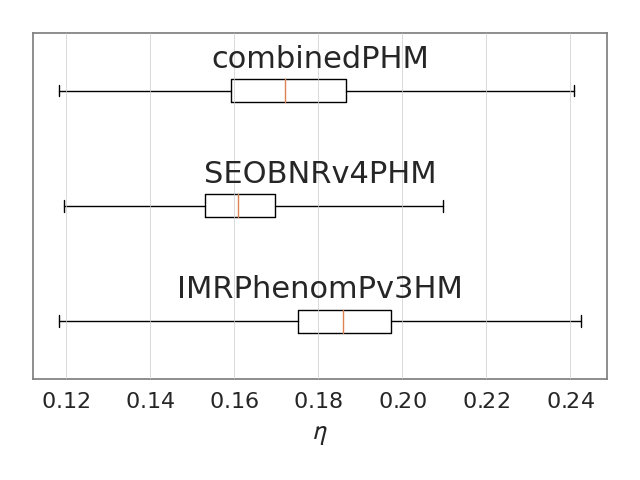
symmetric_mass_ratio
The figures below show the summary plots for the run
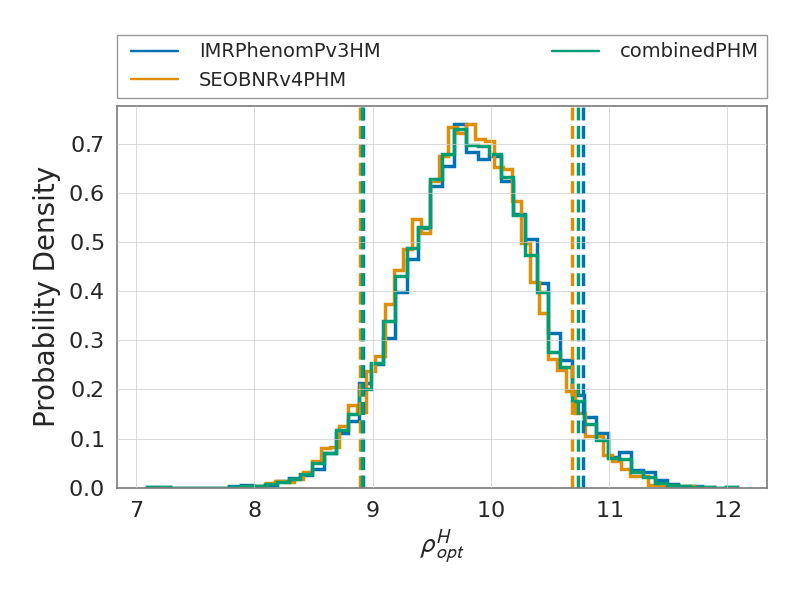
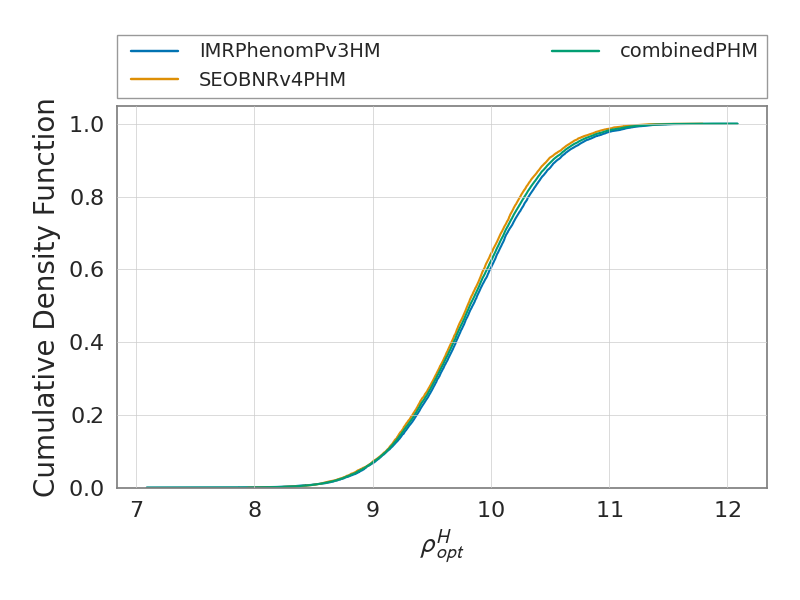
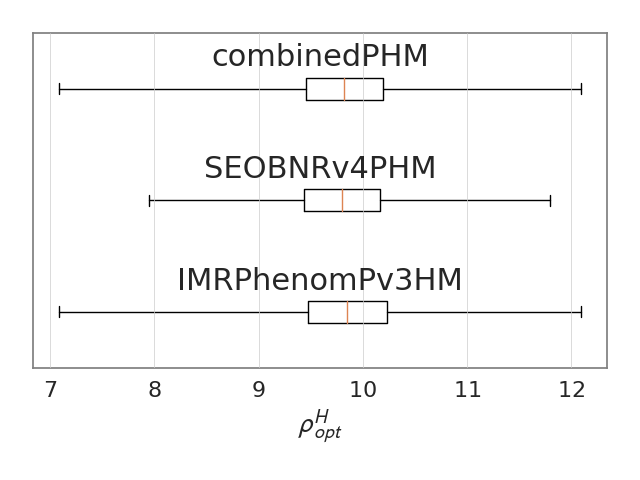
H1_optimal_snr
The figures below show the summary plots for the run
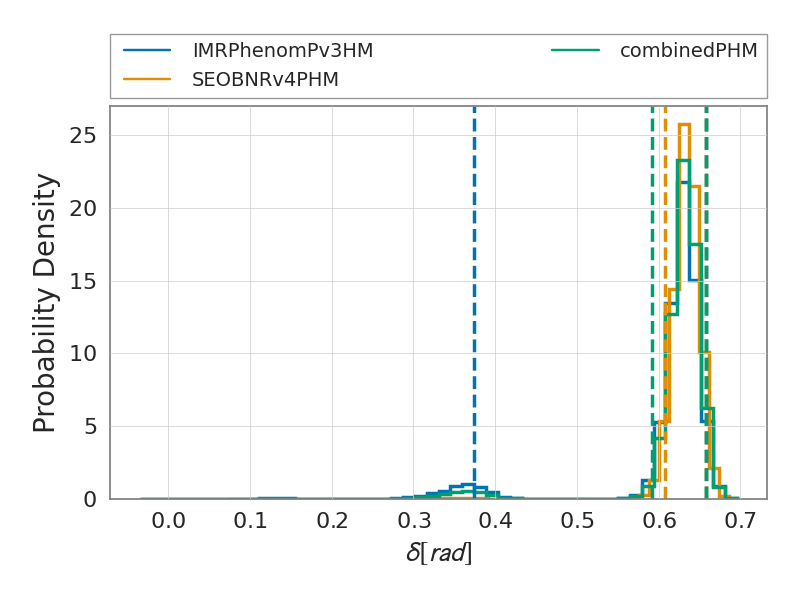
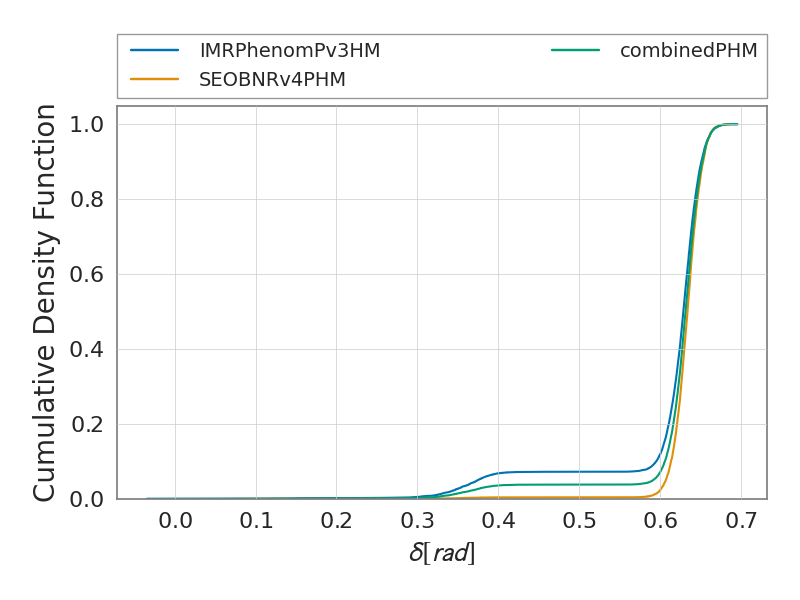
dec
The figures below show the summary plots for the run
recalib_L1_frequency_7
The figures below show the summary plots for the run
total_mass
The figures below show the summary plots for the run
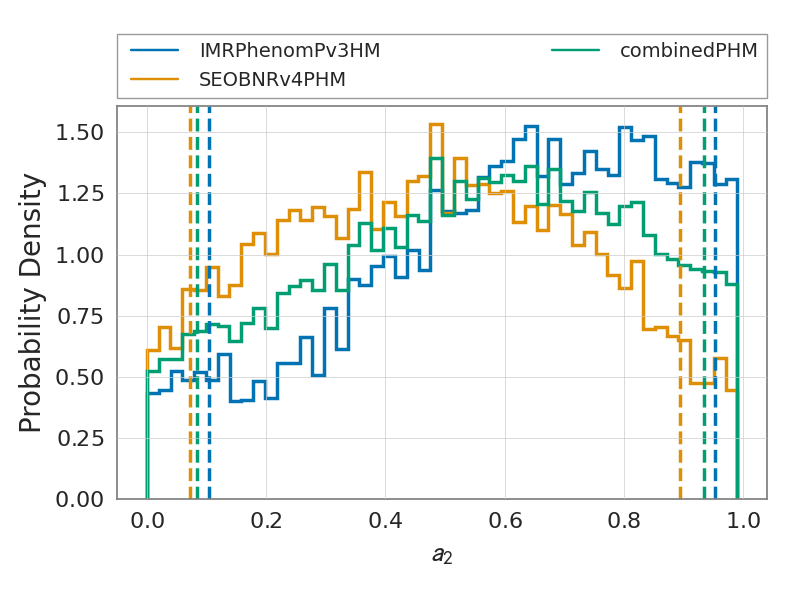
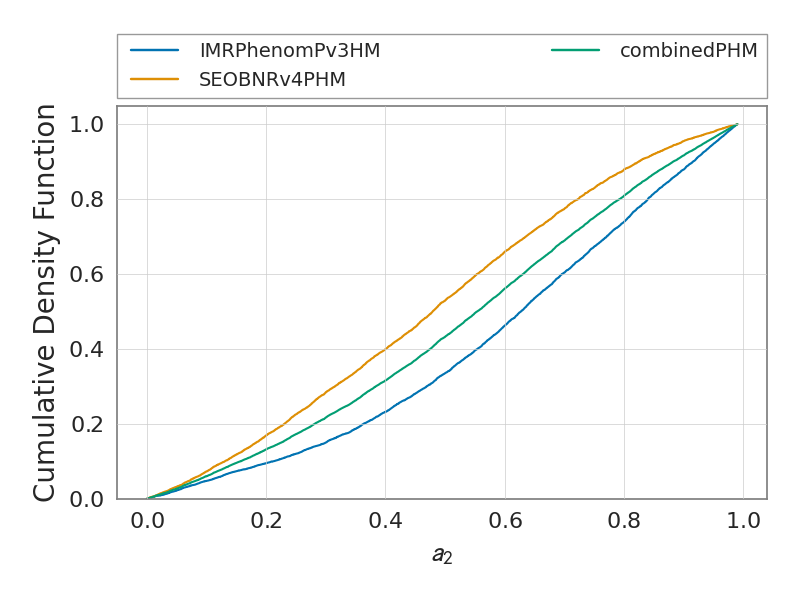
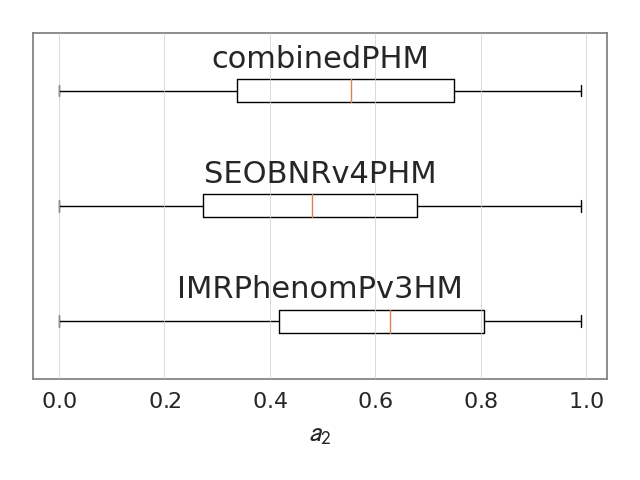
a_2
The figures below show the summary plots for the run
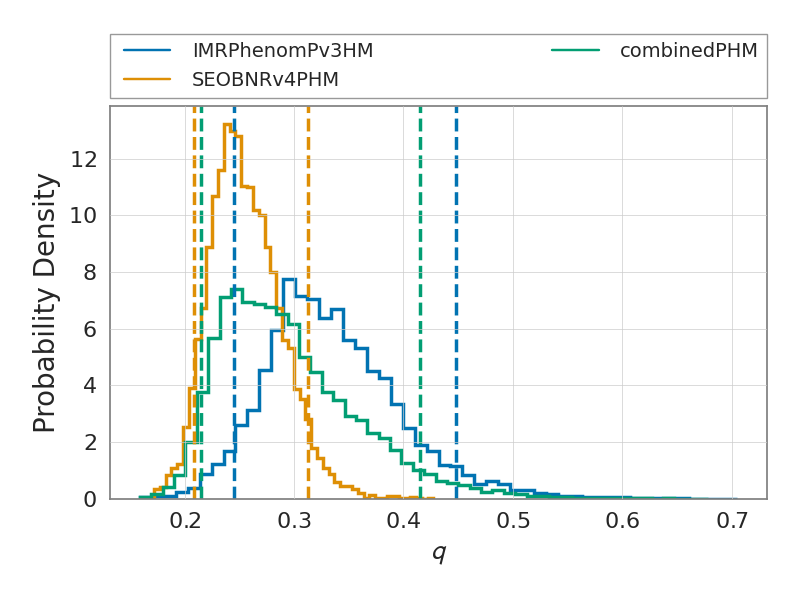
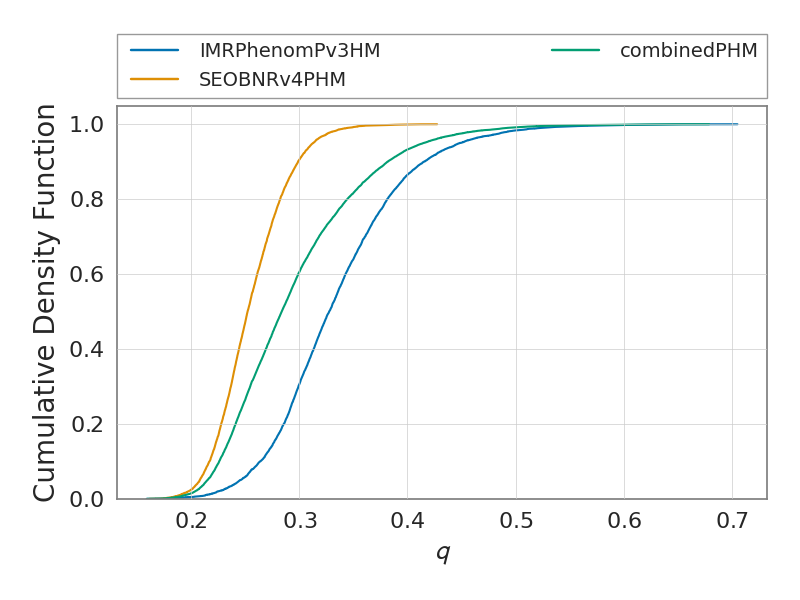
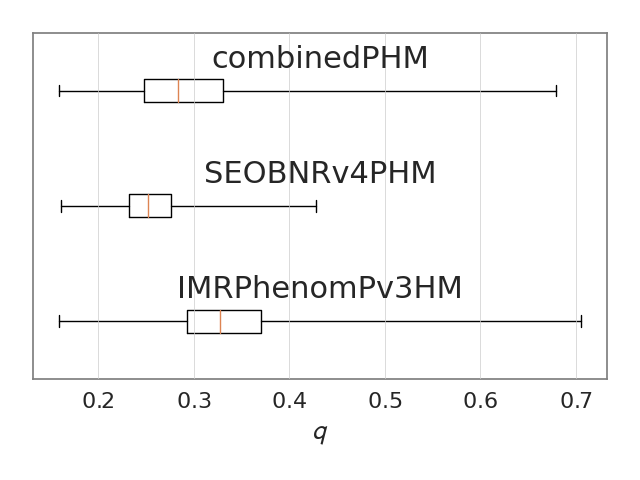
mass_ratio
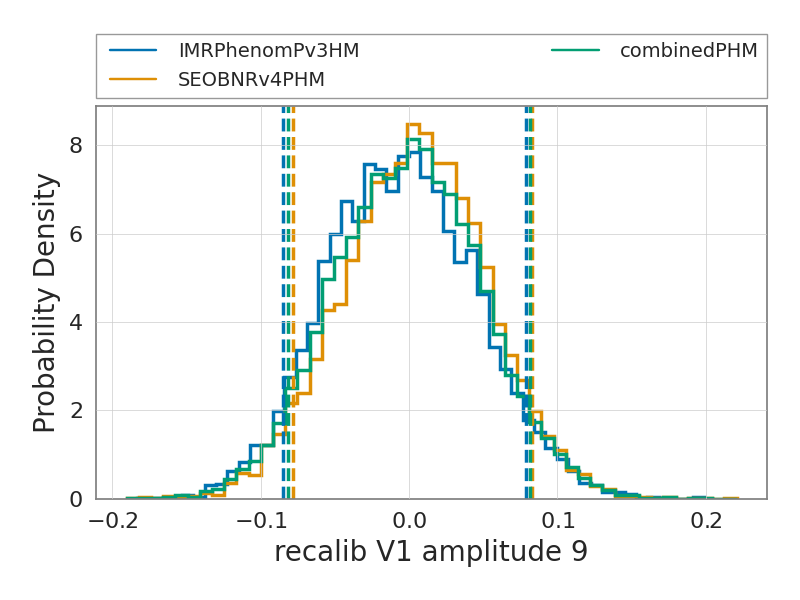
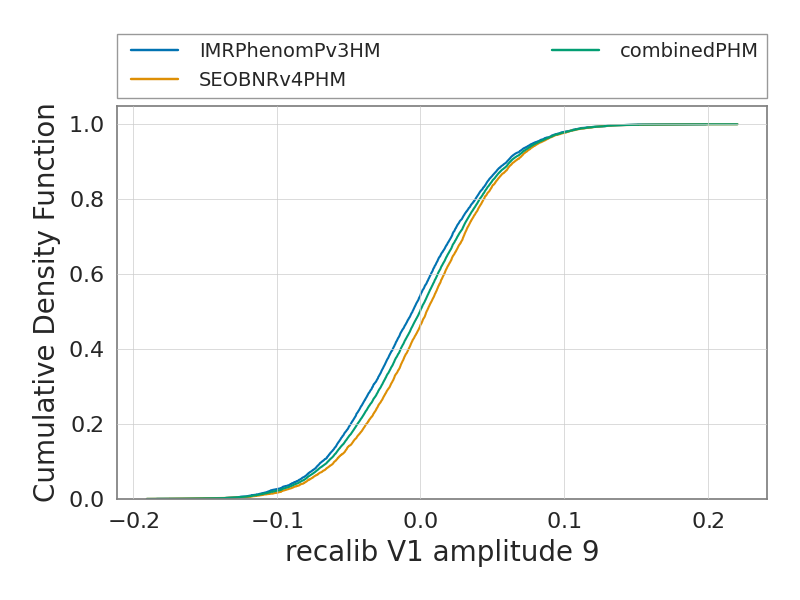
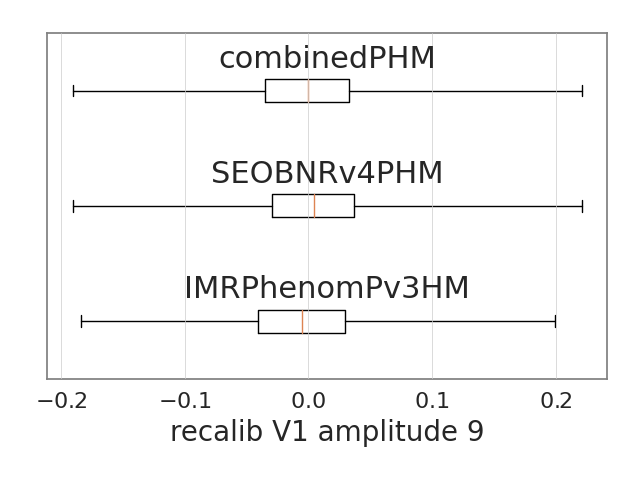
The figures below show the summary plots for the run
recalib_V1_amplitude_9
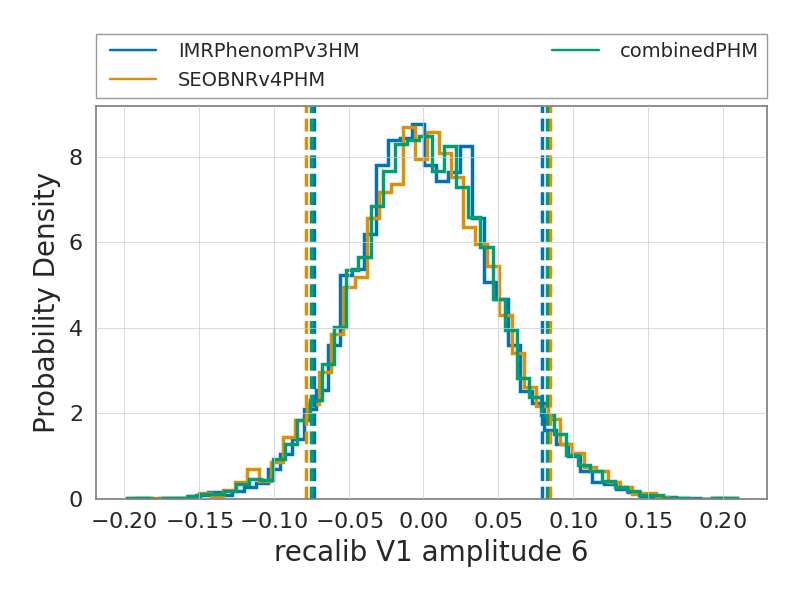
The figures below show the summary plots for the run
recalib_V1_amplitude_6
The figures below show the summary plots for the run
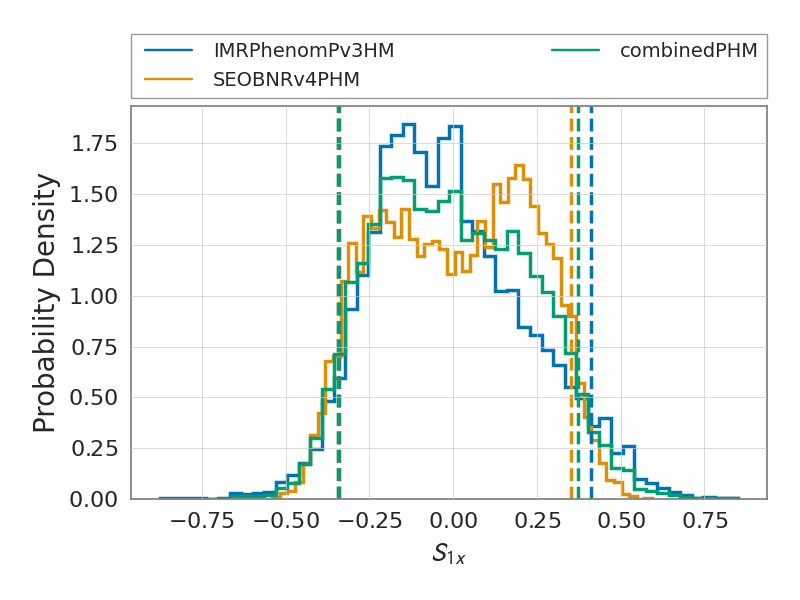
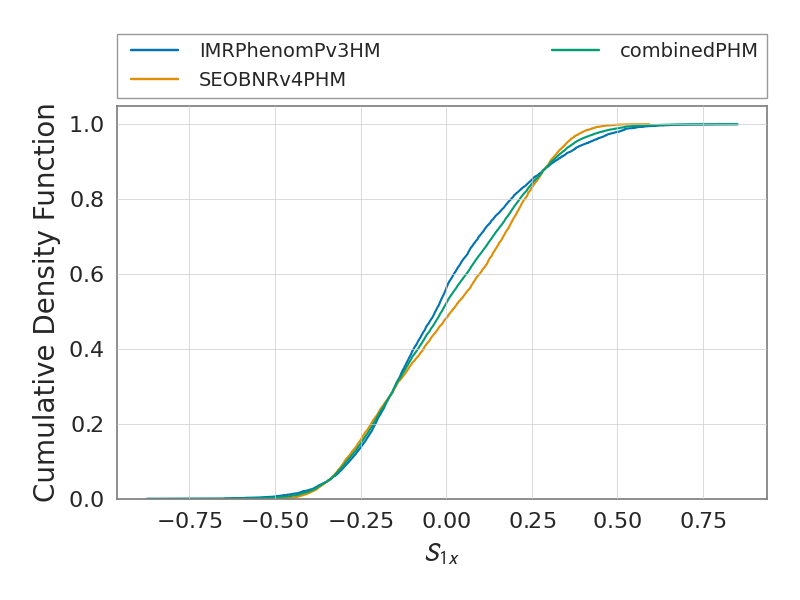
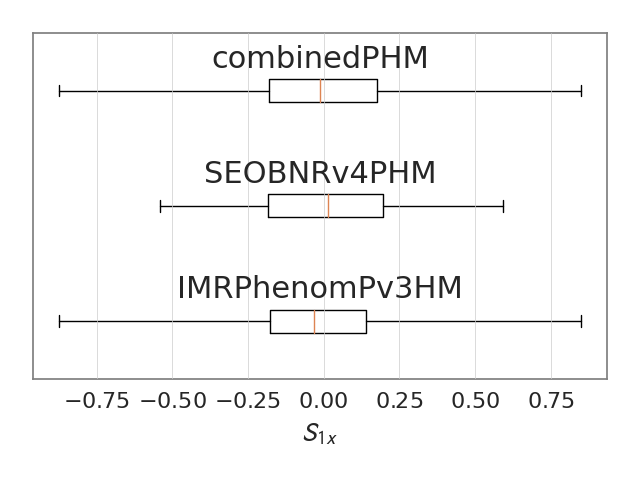
spin_1x
The figures below show the summary plots for the run
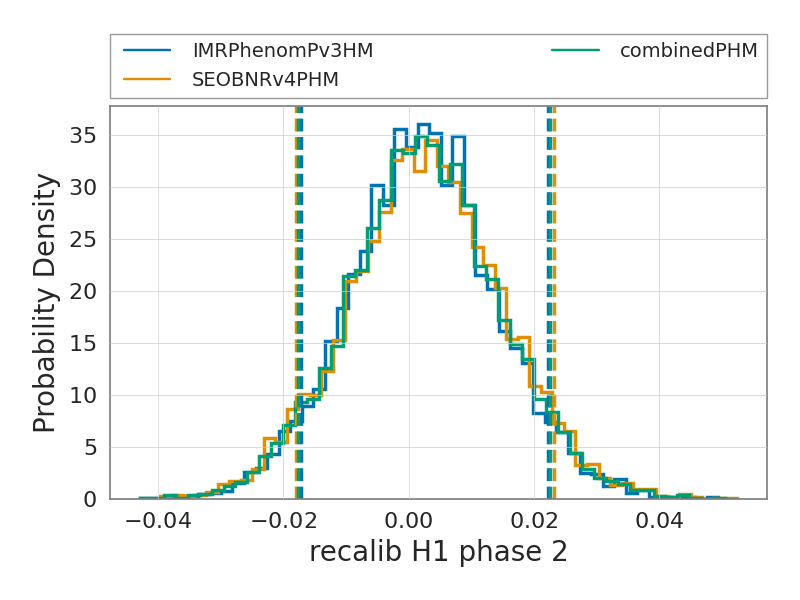
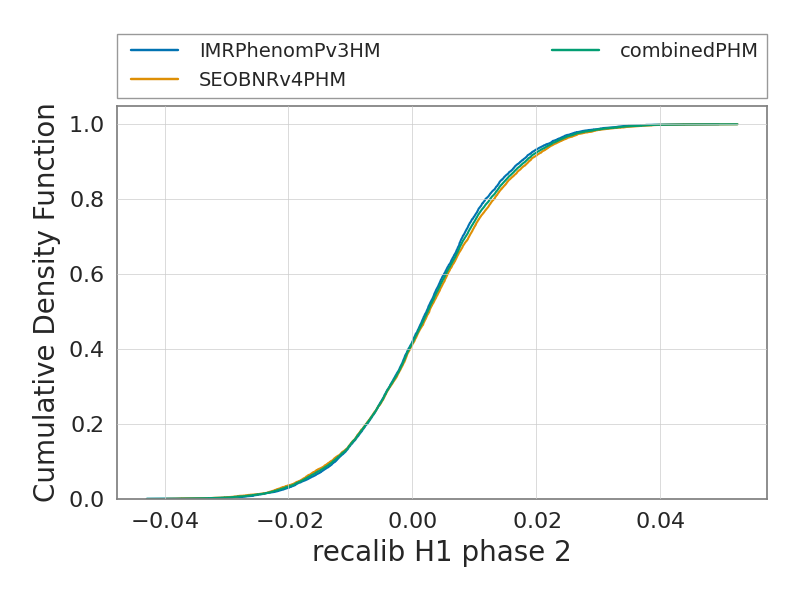
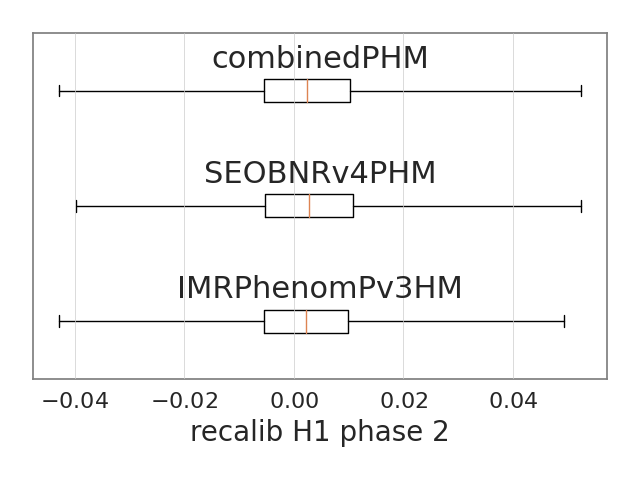
recalib_H1_phase_2
The figures below show the summary plots for the run
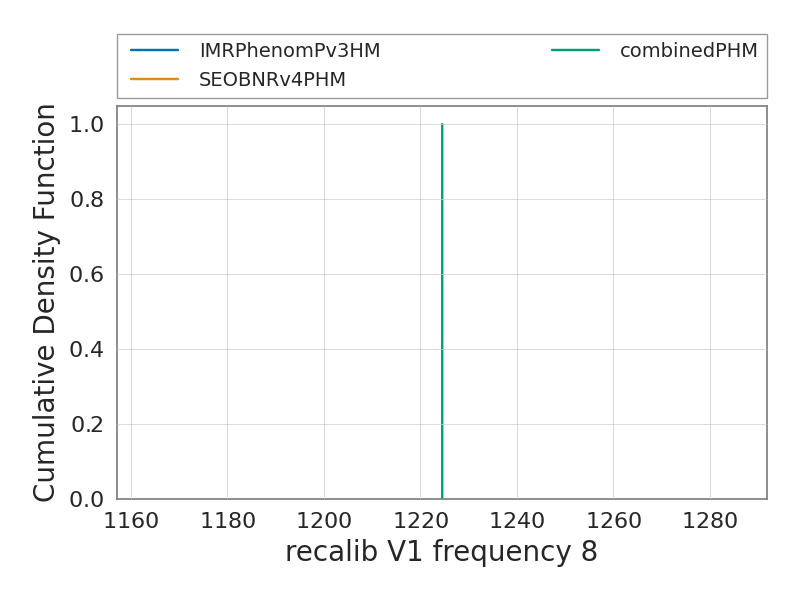
recalib_V1_frequency_8
The figures below show the summary plots for the run
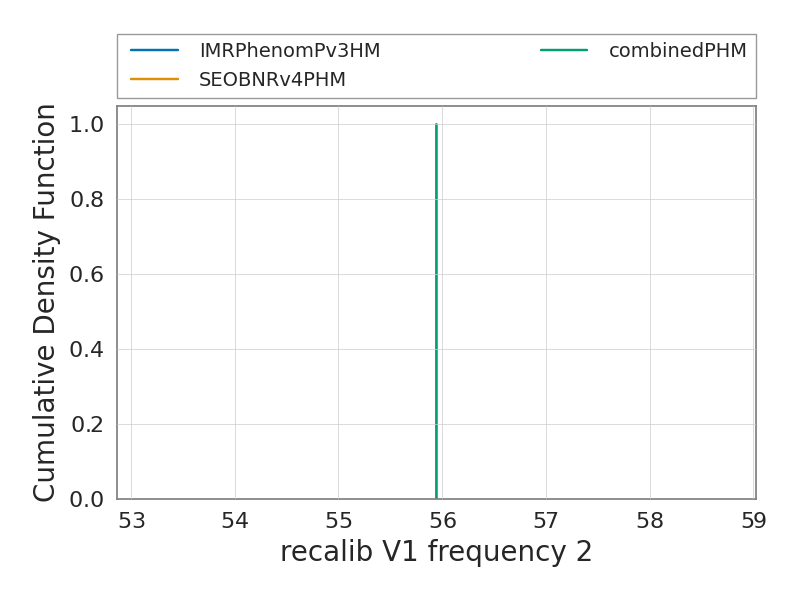
recalib_V1_frequency_2
The figures below show the summary plots for the run
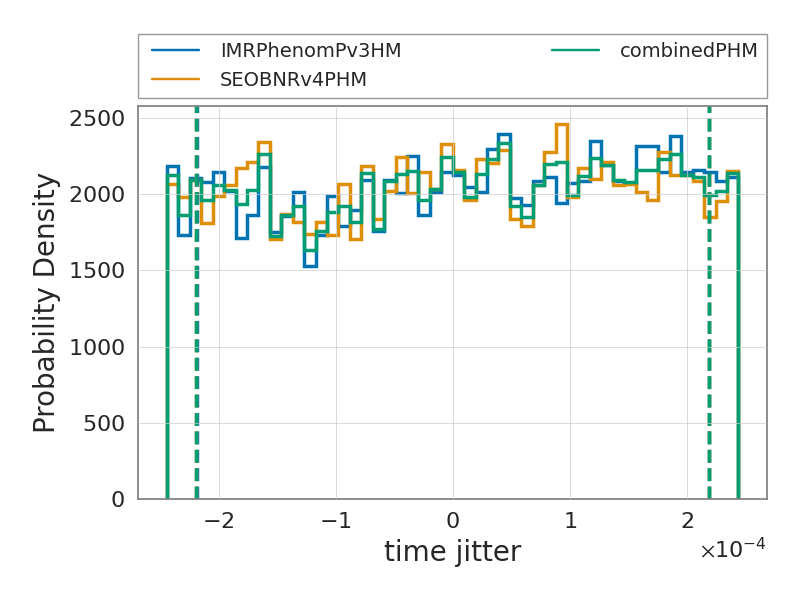
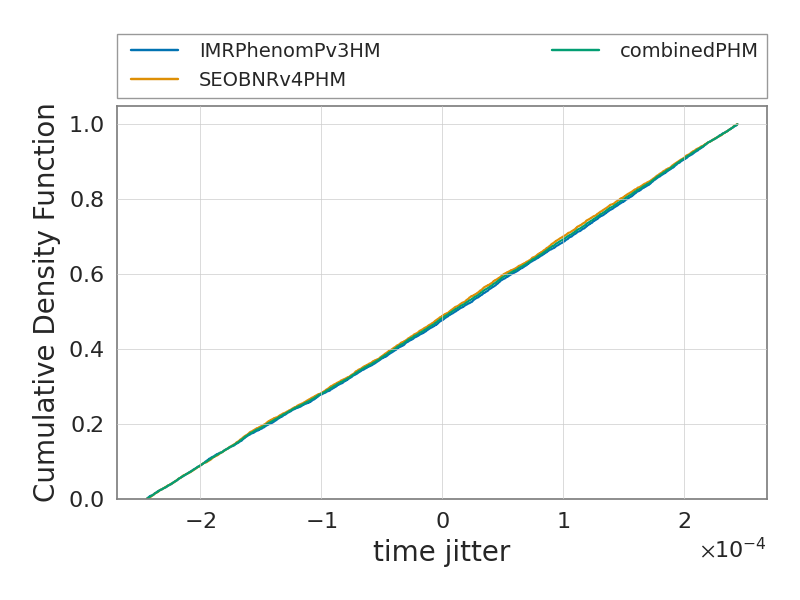
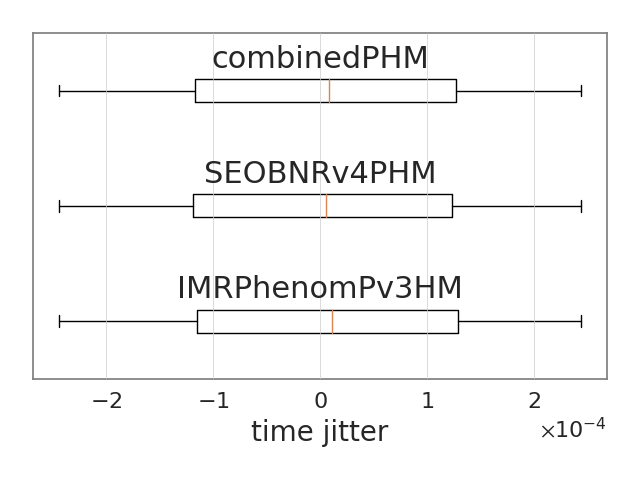
time_jitter
The figures below show the summary plots for the run
tilt_2
The figures below show the summary plots for the run
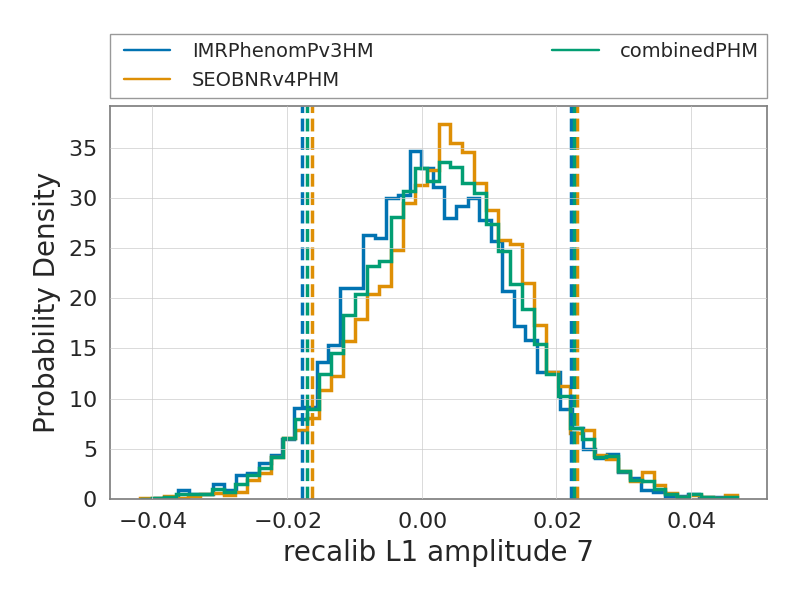
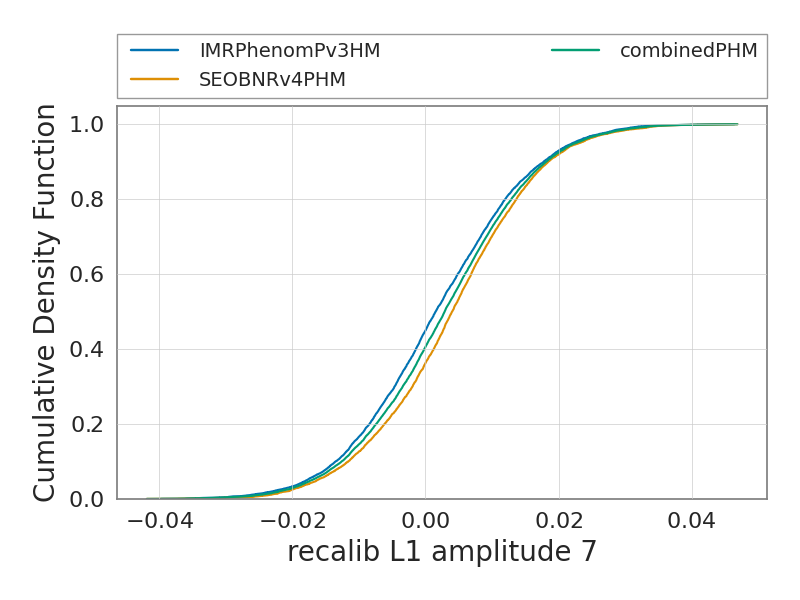
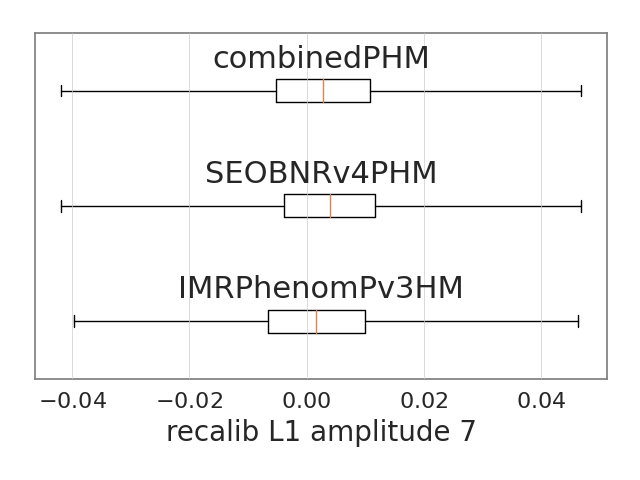
recalib_L1_amplitude_7
The figures below show the summary plots for the run
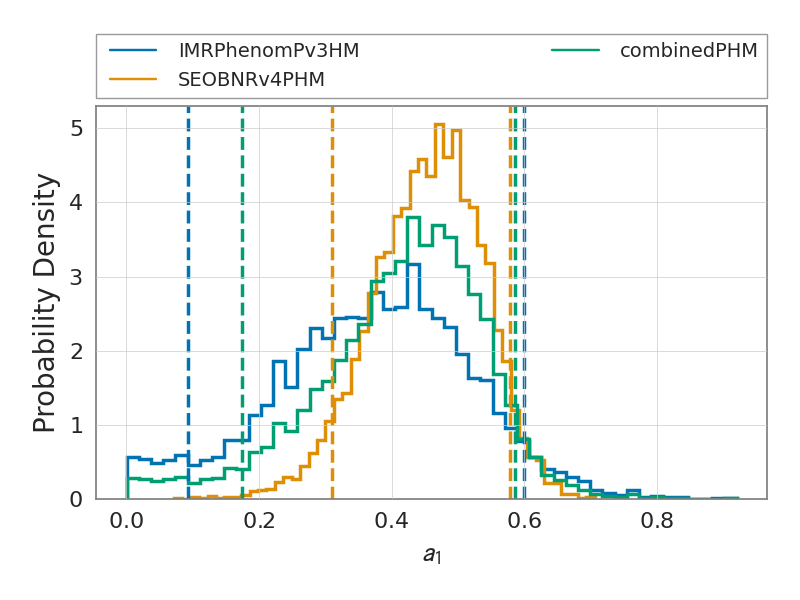
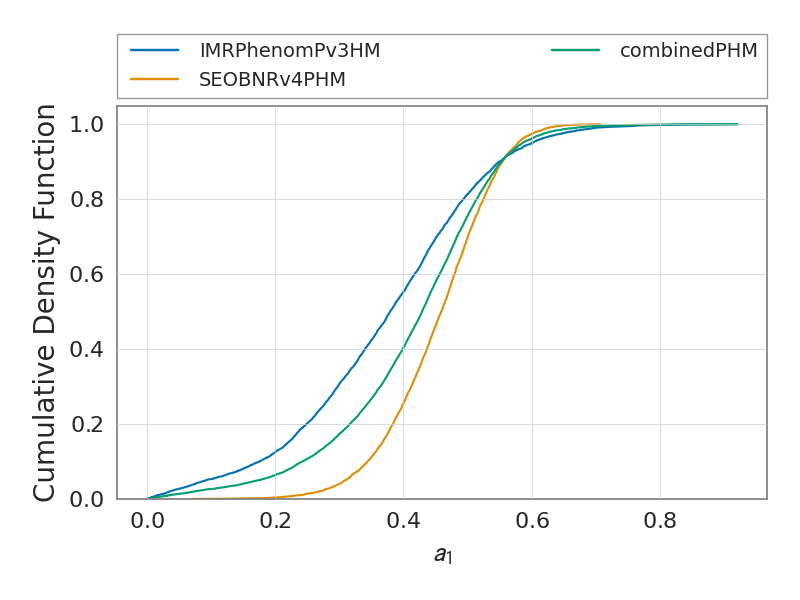
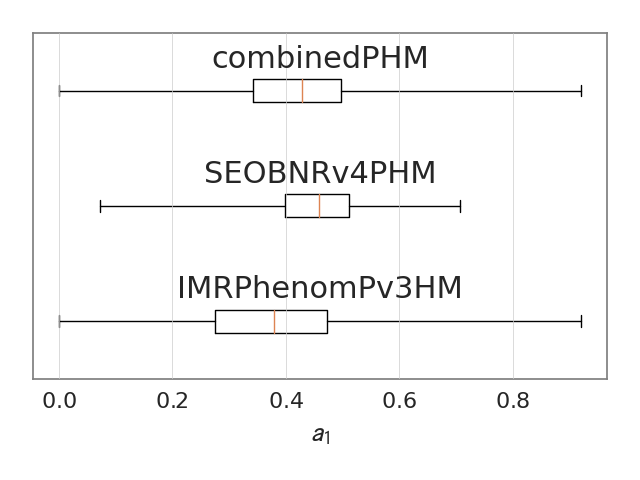
a_1
The figures below show the summary plots for the run
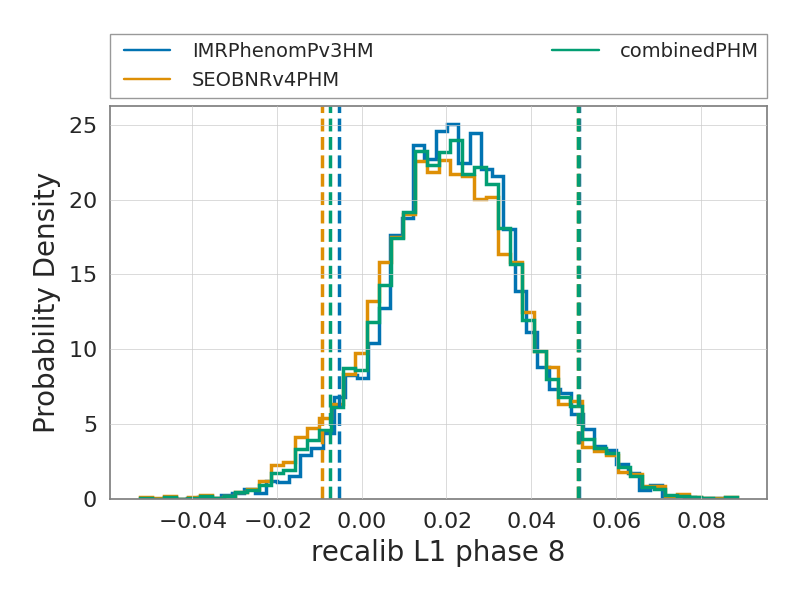
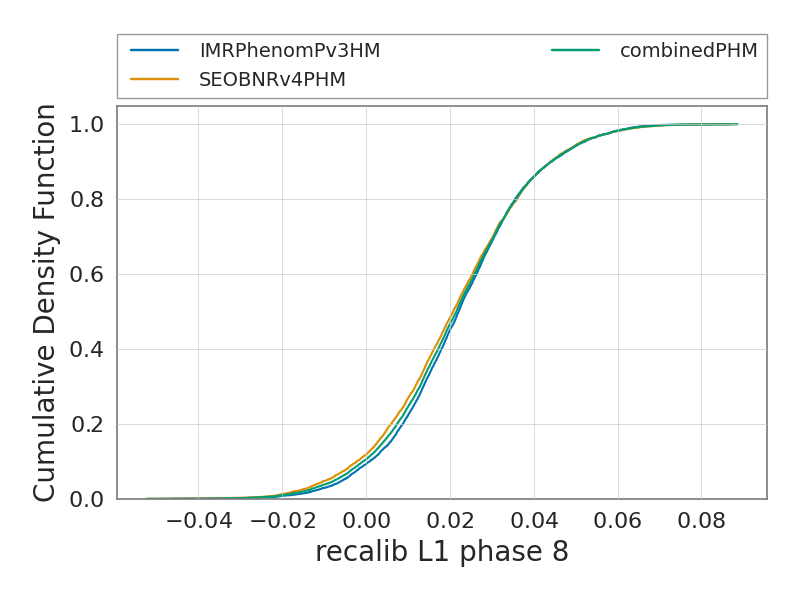
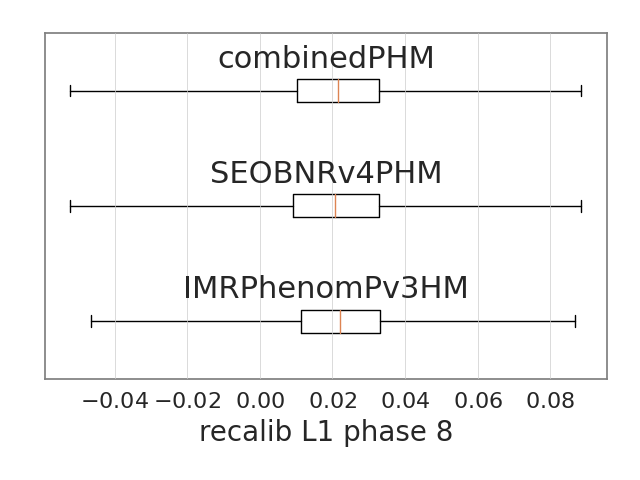
recalib_L1_phase_8
The figures below show the summary plots for the run
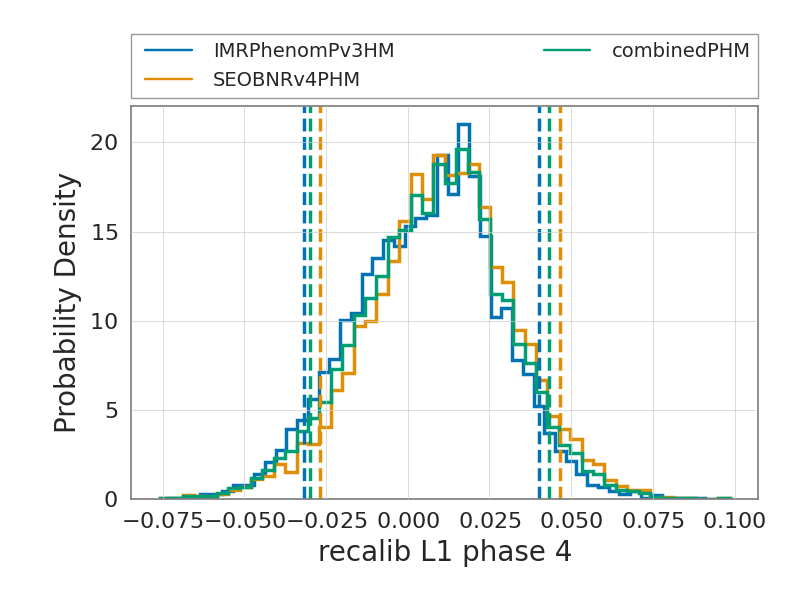
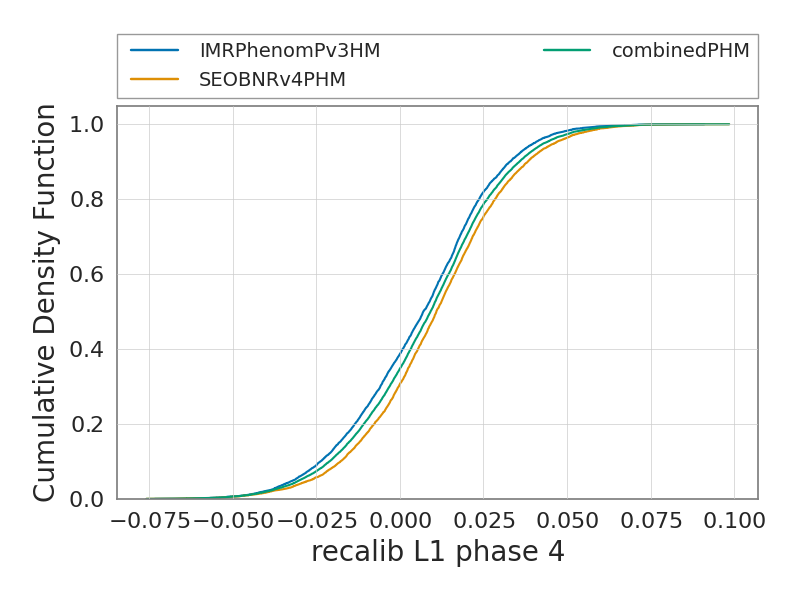
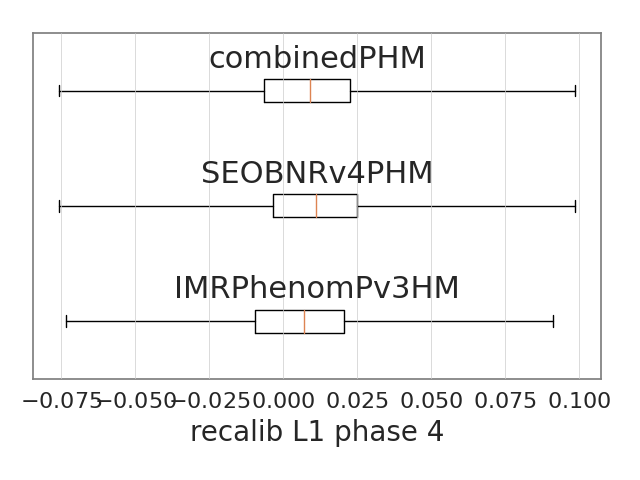
recalib_L1_phase_4
The figures below show the summary plots for the run
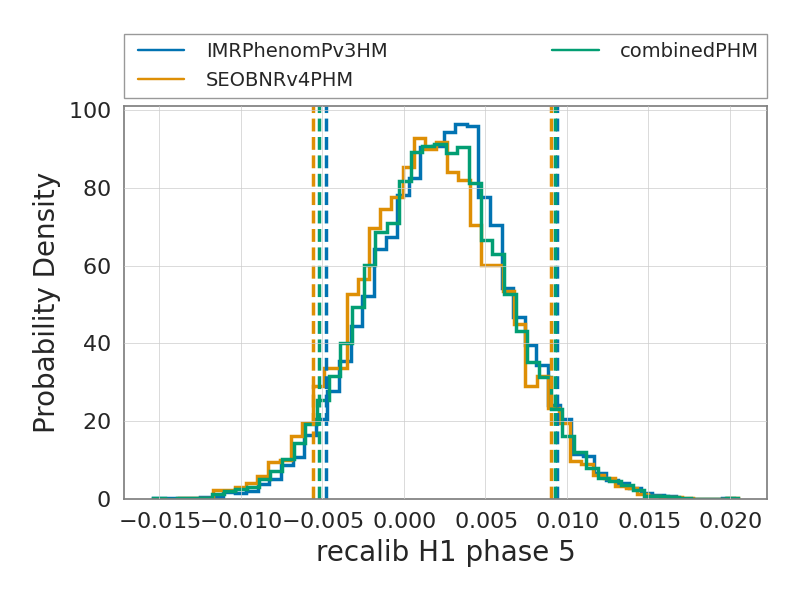
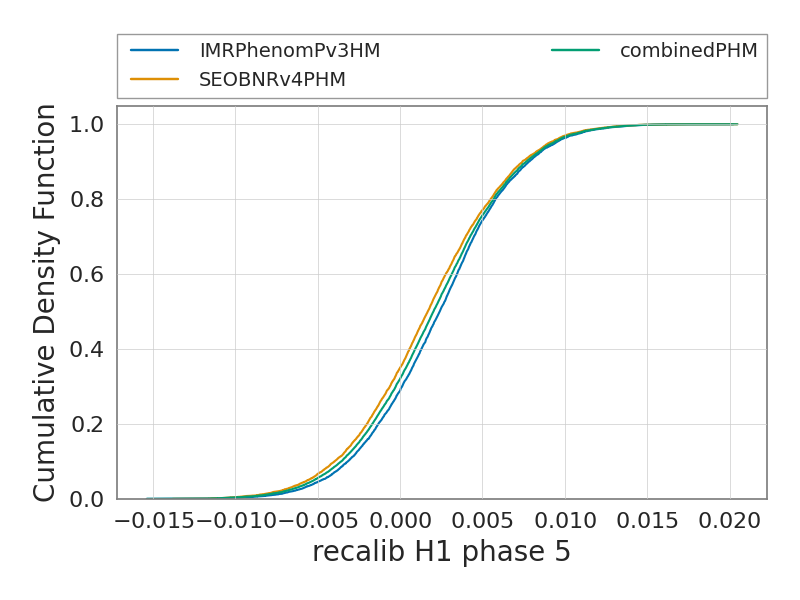
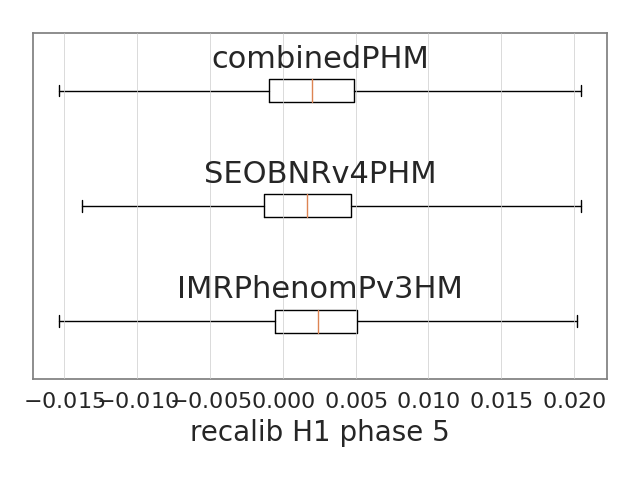
recalib_H1_phase_5
The figures below show the summary plots for the run
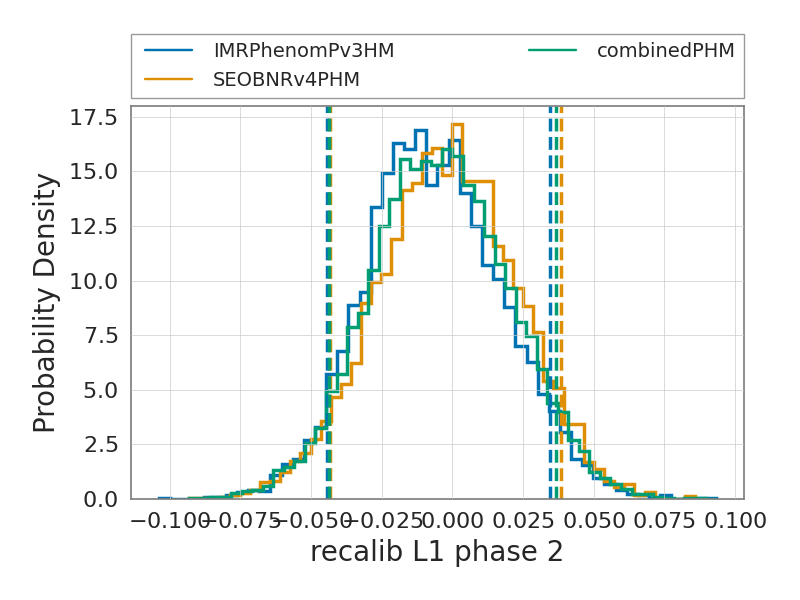
recalib_L1_phase_2
The figures below show the summary plots for the run
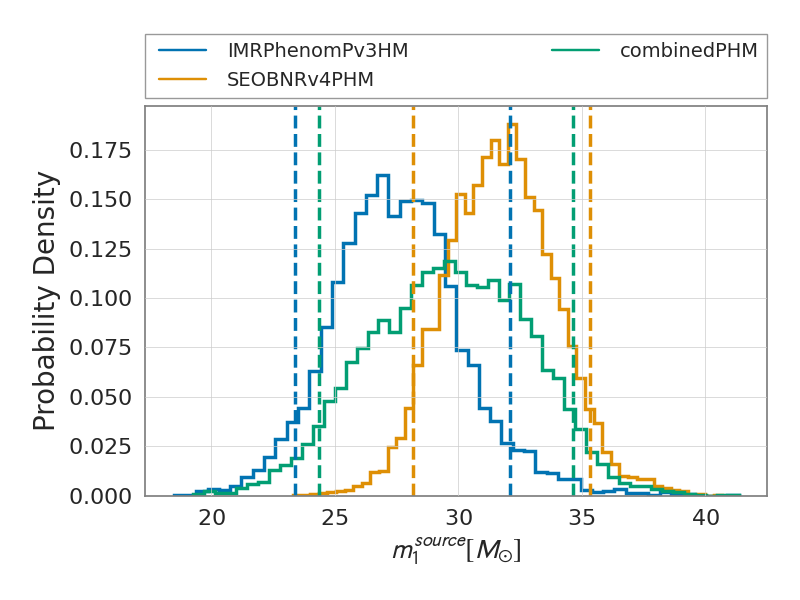
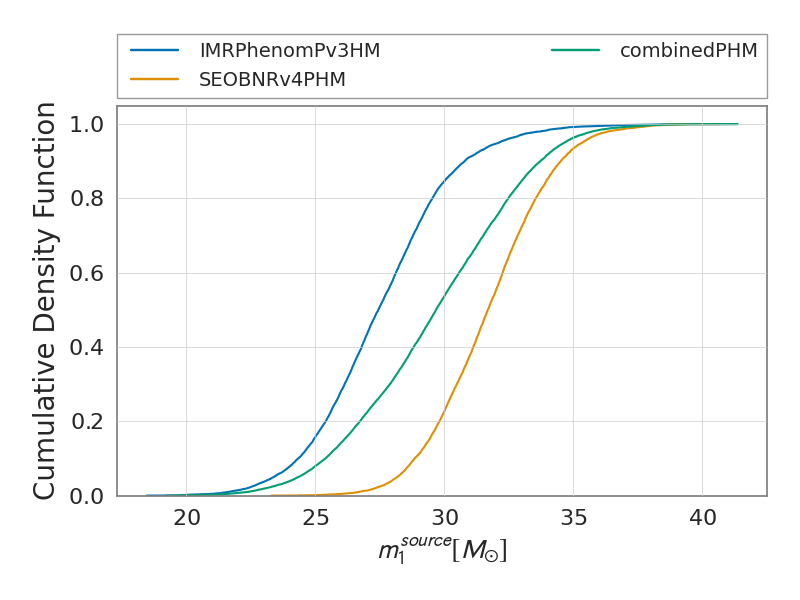
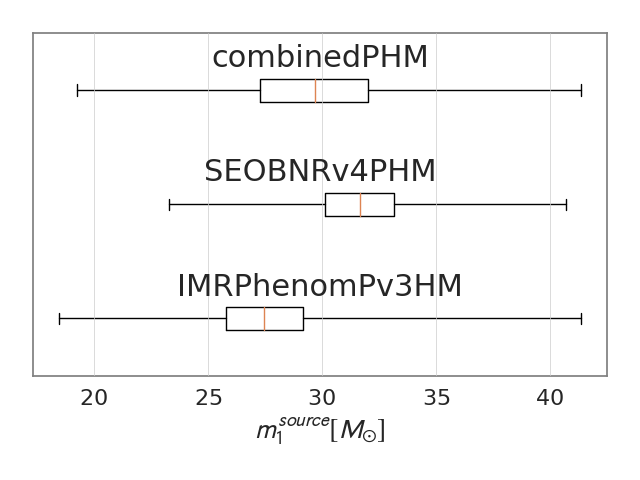
mass_1_source
The figures below show the summary plots for the run
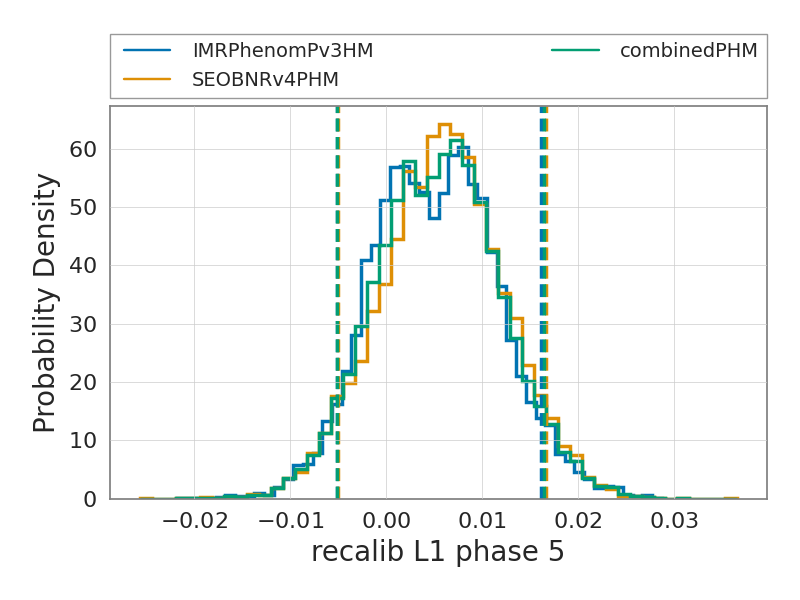
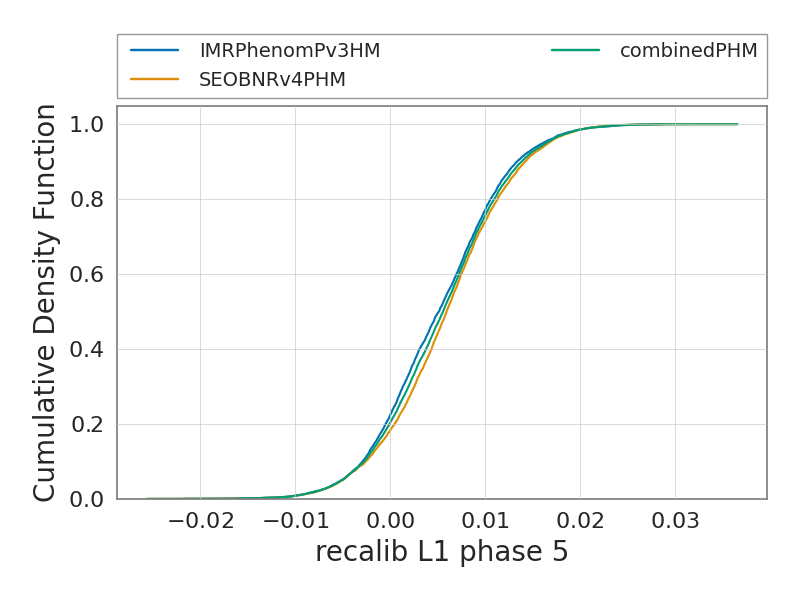
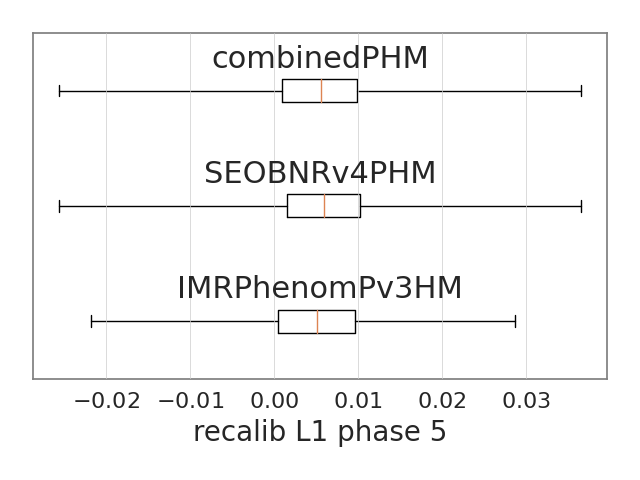
recalib_L1_phase_5
The figures below show the summary plots for the run
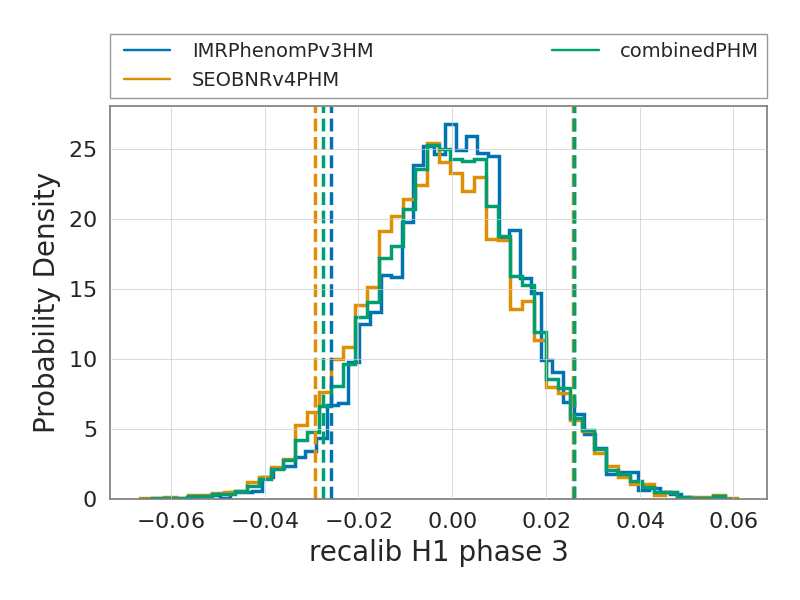
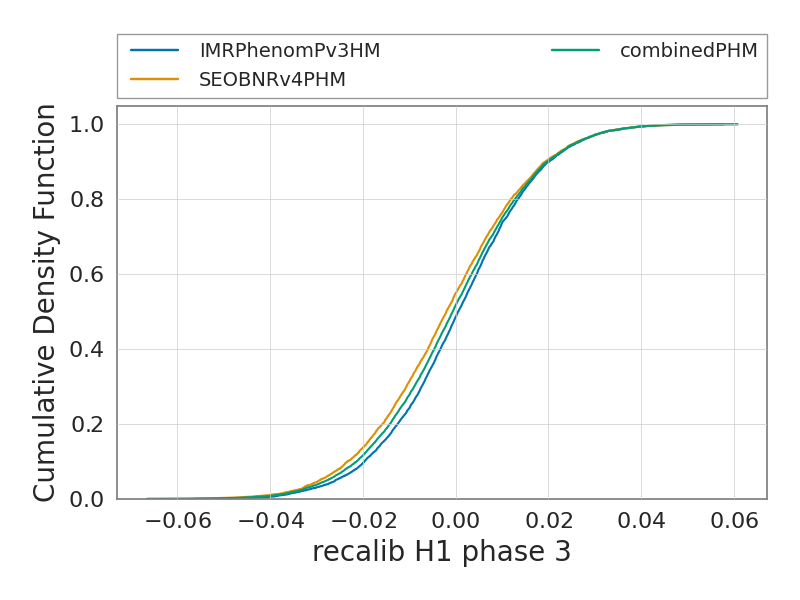
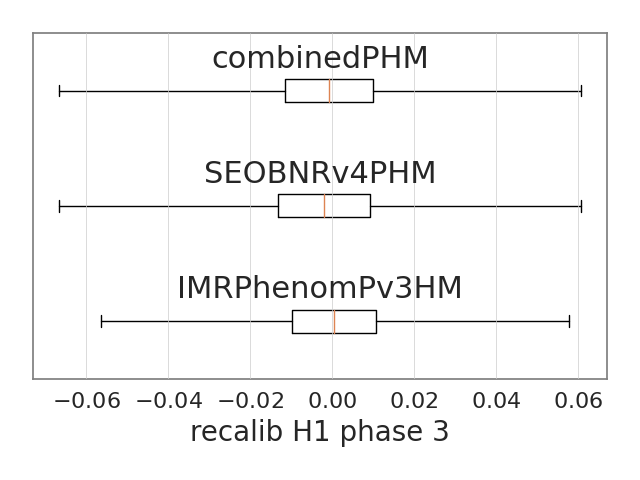
recalib_H1_phase_3
The figures below show the summary plots for the run
recalib_L1_frequency_8
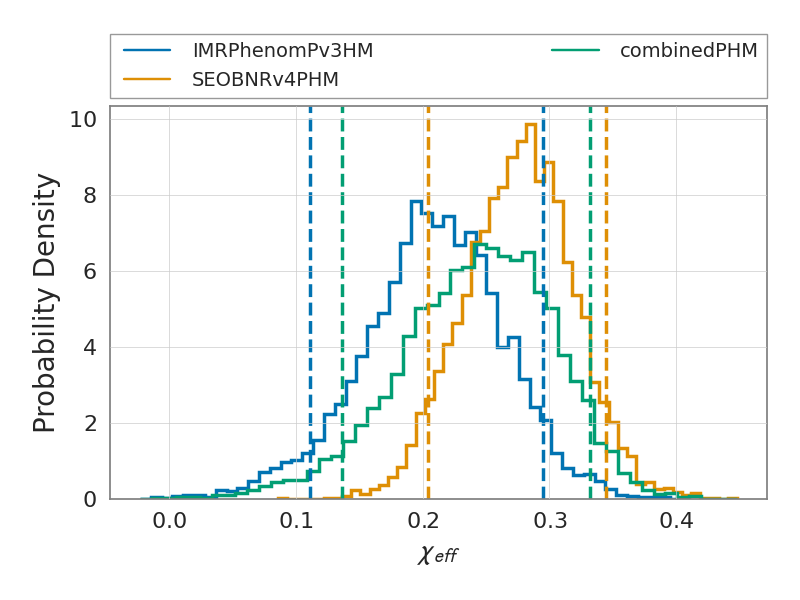
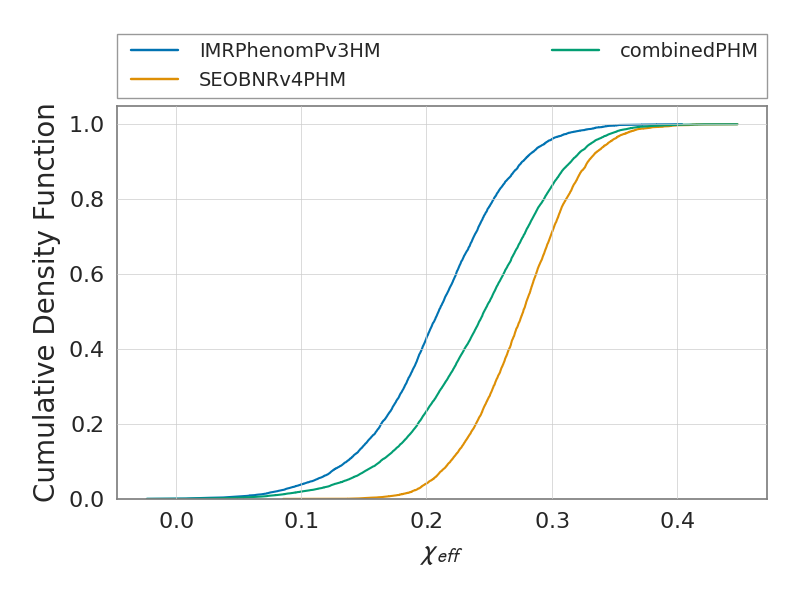
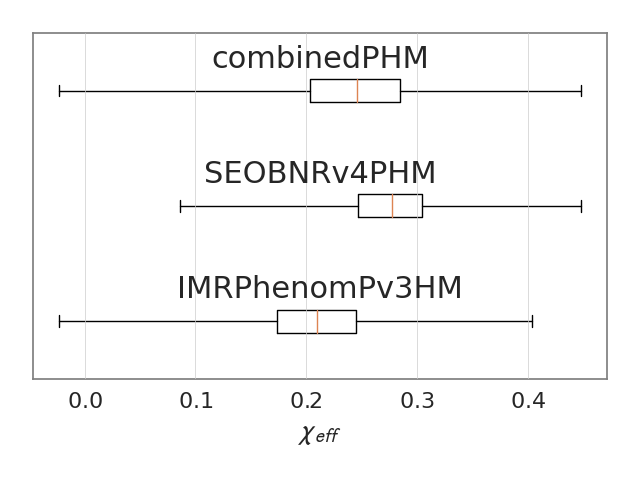
The figures below show the summary plots for the run
chi_eff
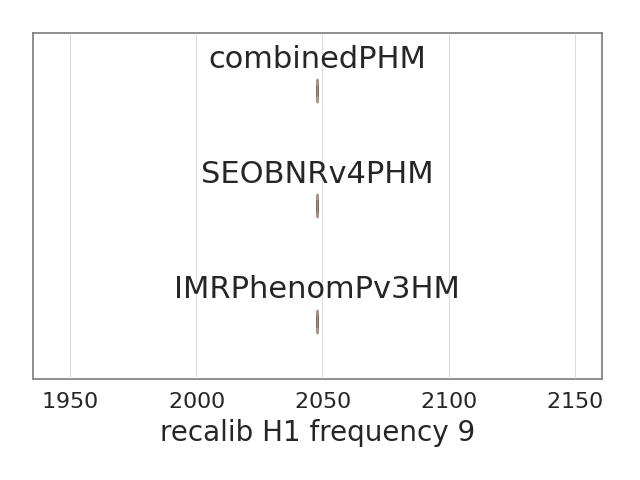
The figures below show the summary plots for the run
recalib_H1_frequency_9
The figures below show the summary plots for the run
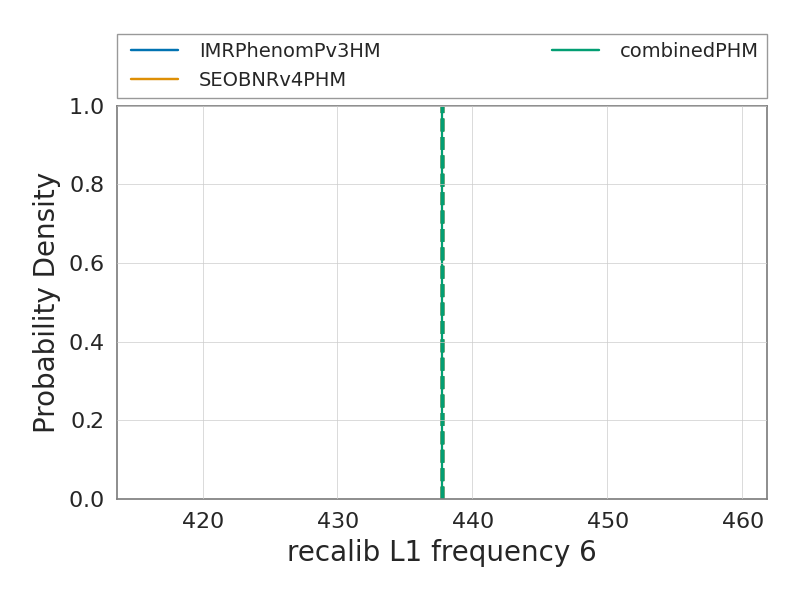
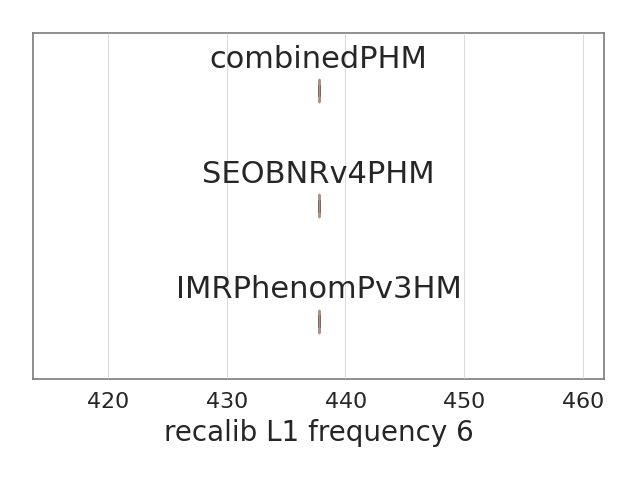
recalib_L1_frequency_6
The figures below show the summary plots for the run
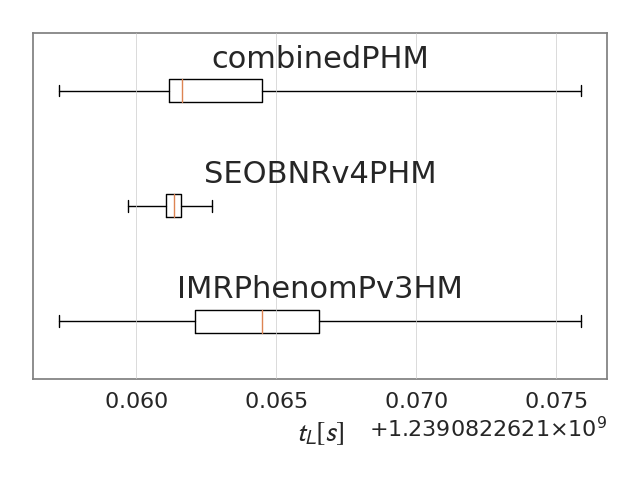
L1_time
The figures below show the summary plots for the run
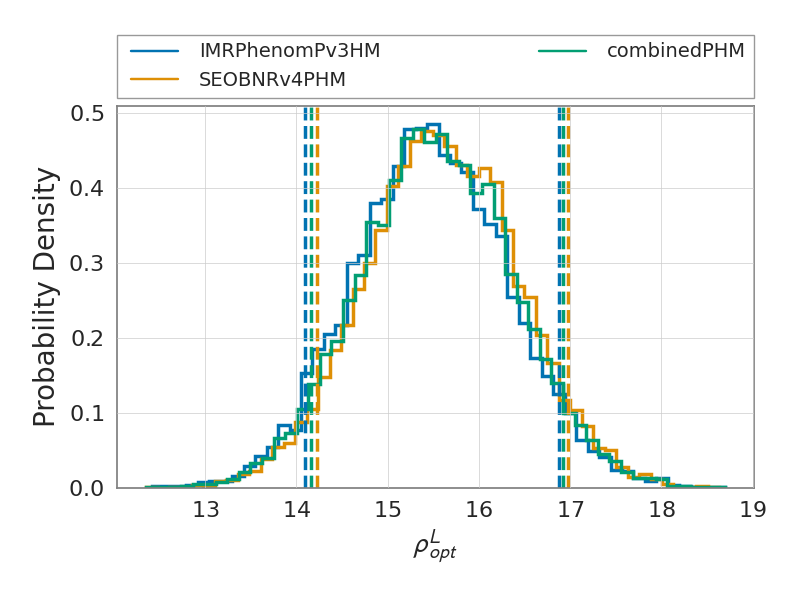
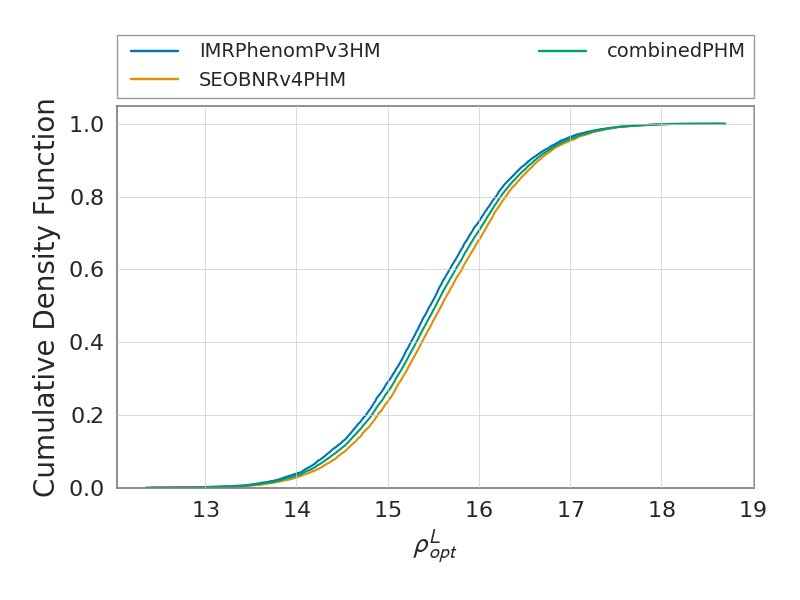
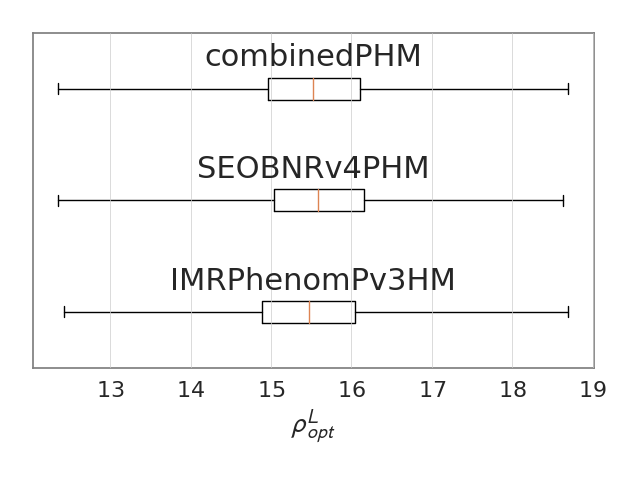
L1_optimal_snr
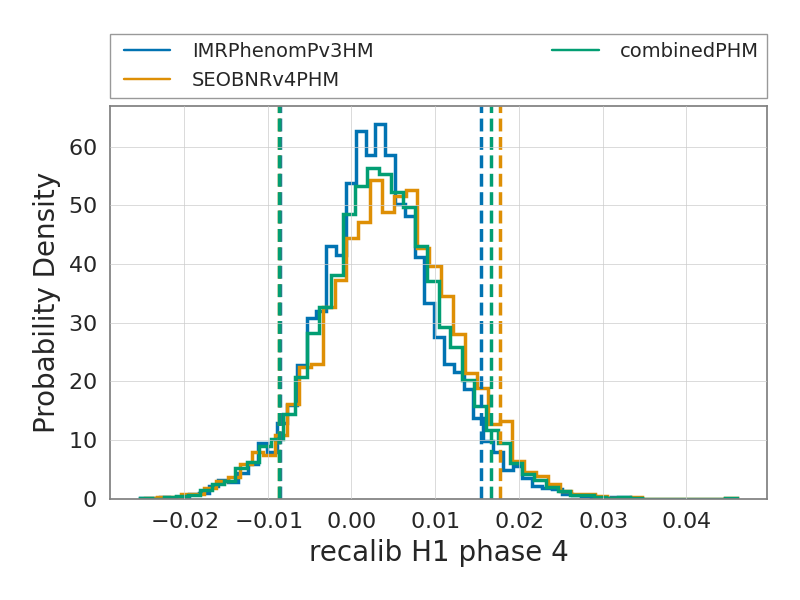
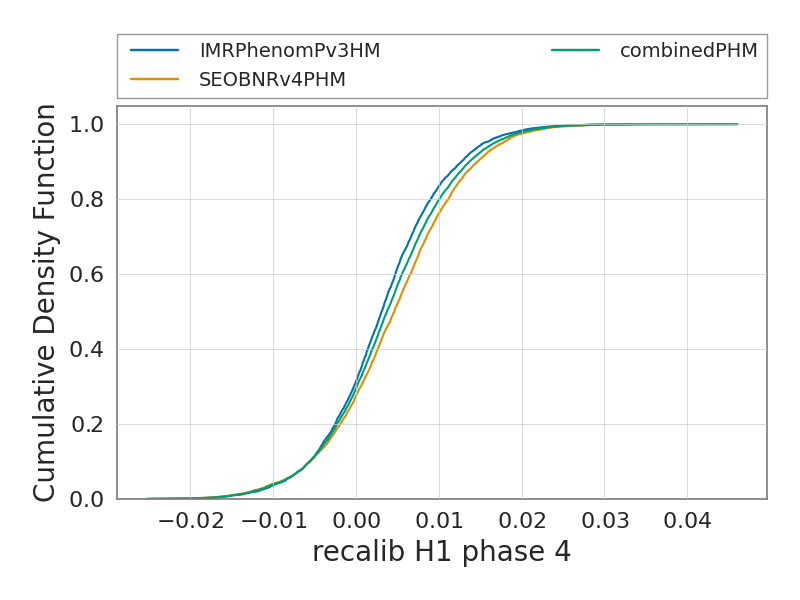
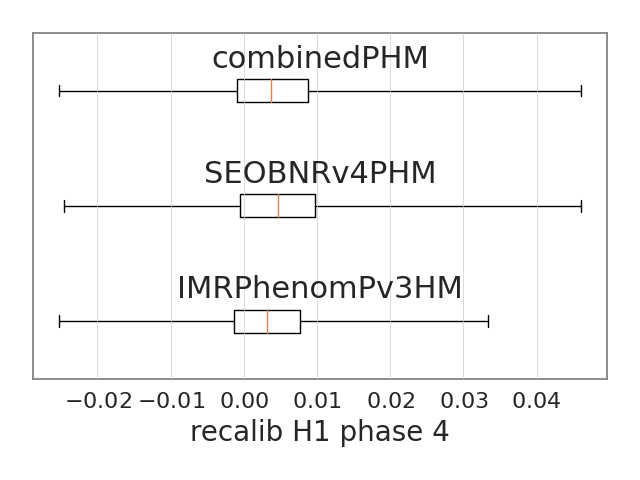
The figures below show the summary plots for the run
recalib_H1_phase_4
The figures below show the summary plots for the run
recalib_H1_amplitude_6
The figures below show the summary plots for the run
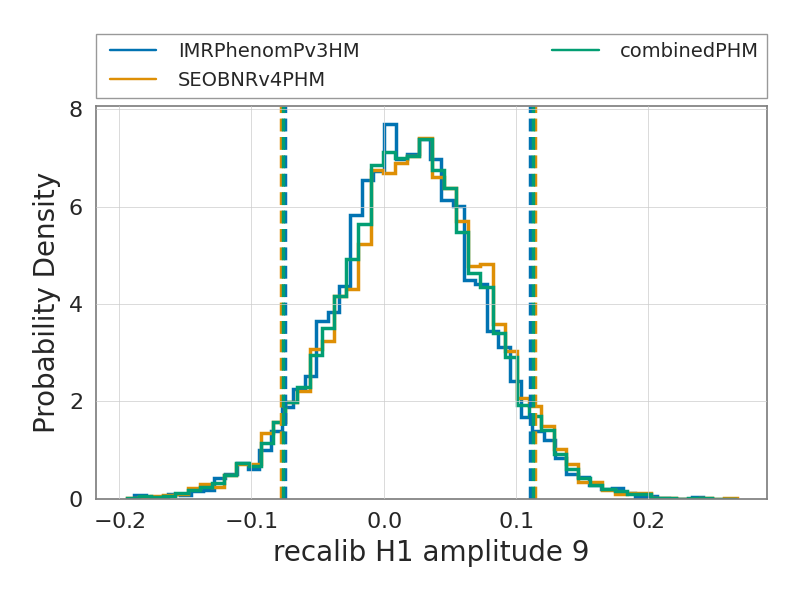
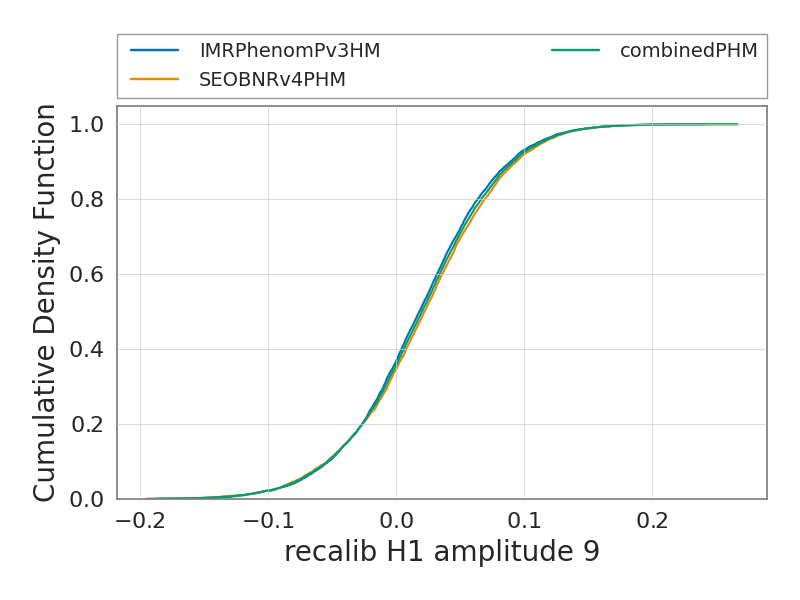
recalib_H1_amplitude_9
The figures below show the summary plots for the run
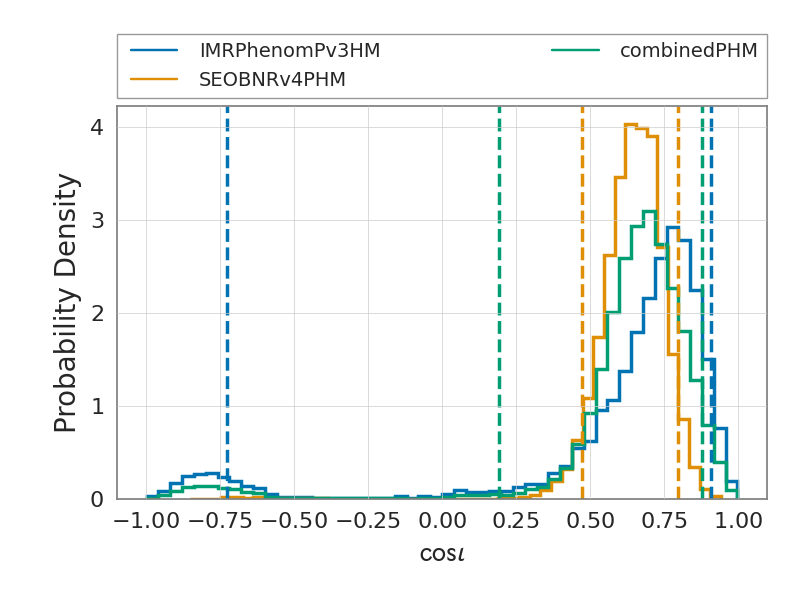
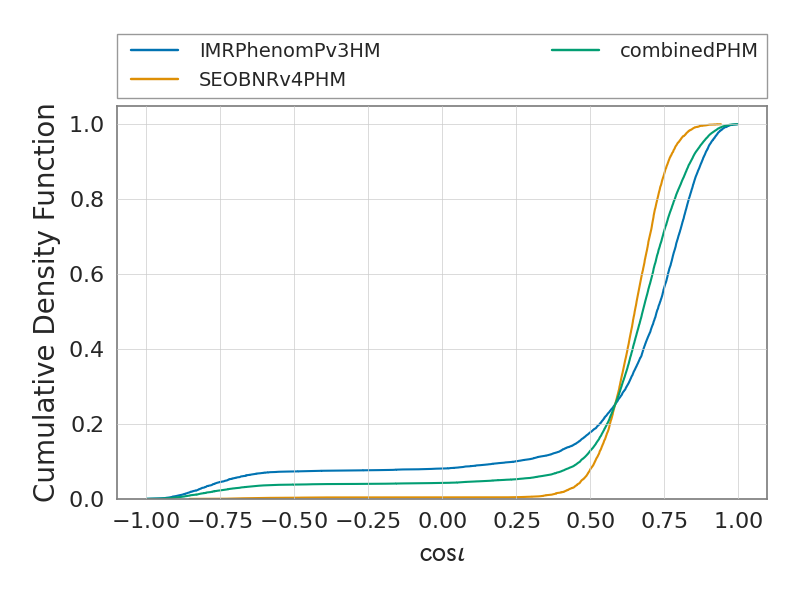
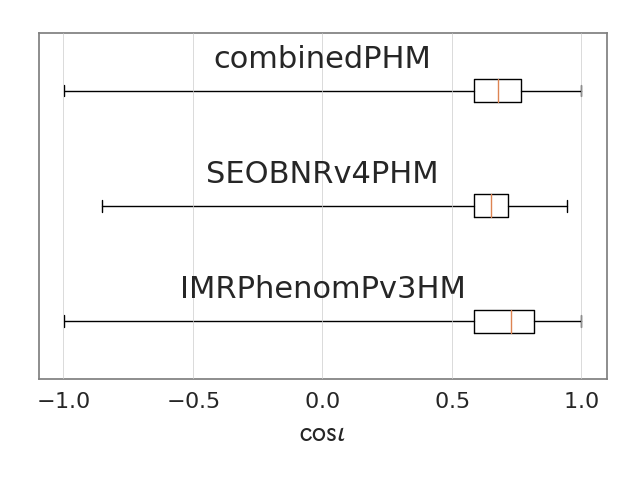
cos_iota
The figures below show the summary plots for the run
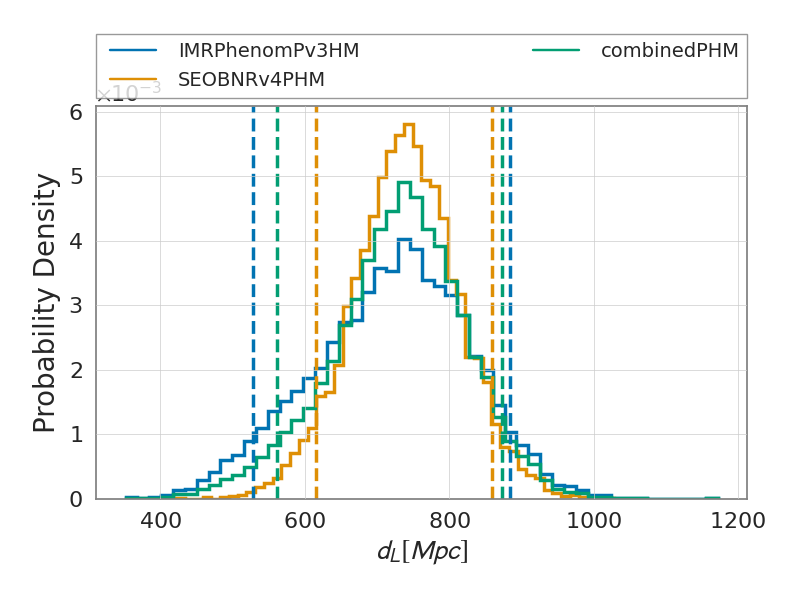
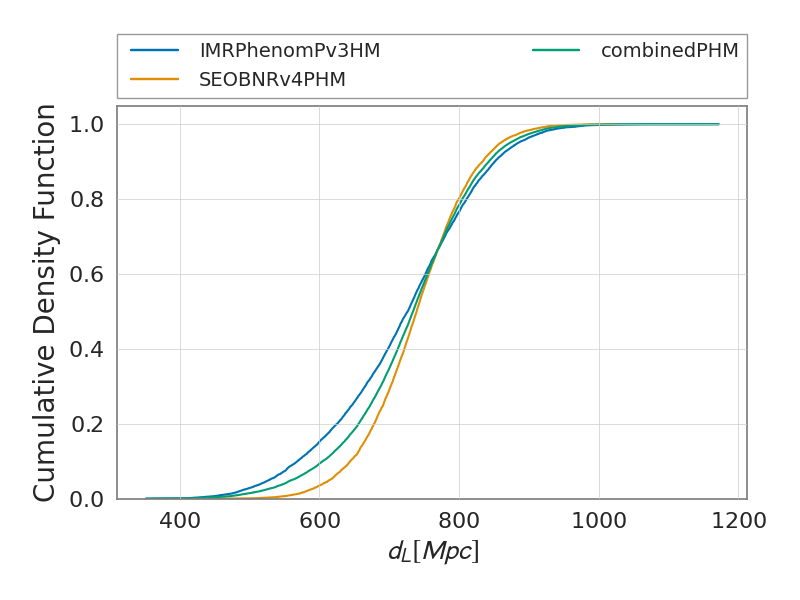
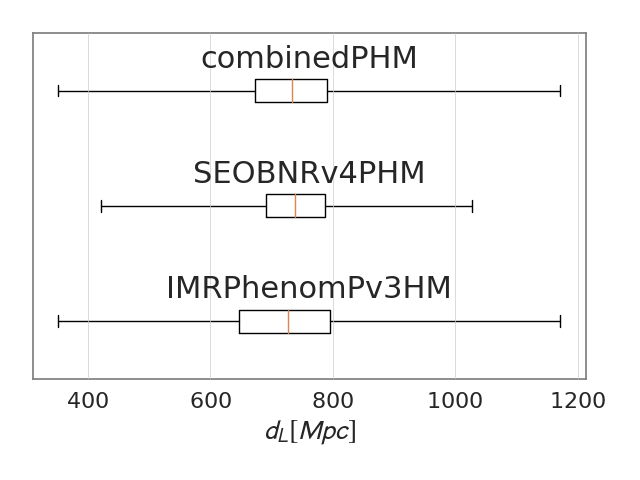
luminosity_distance
The figures below show the summary plots for the run
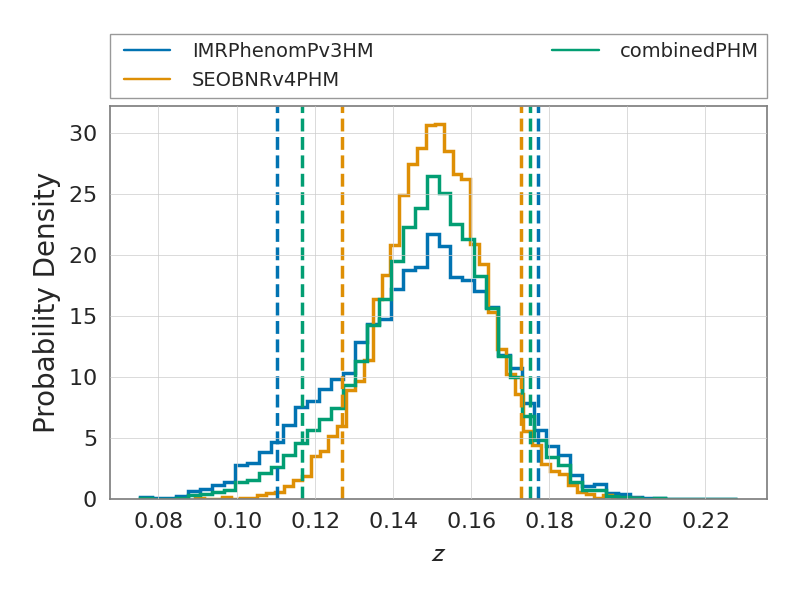
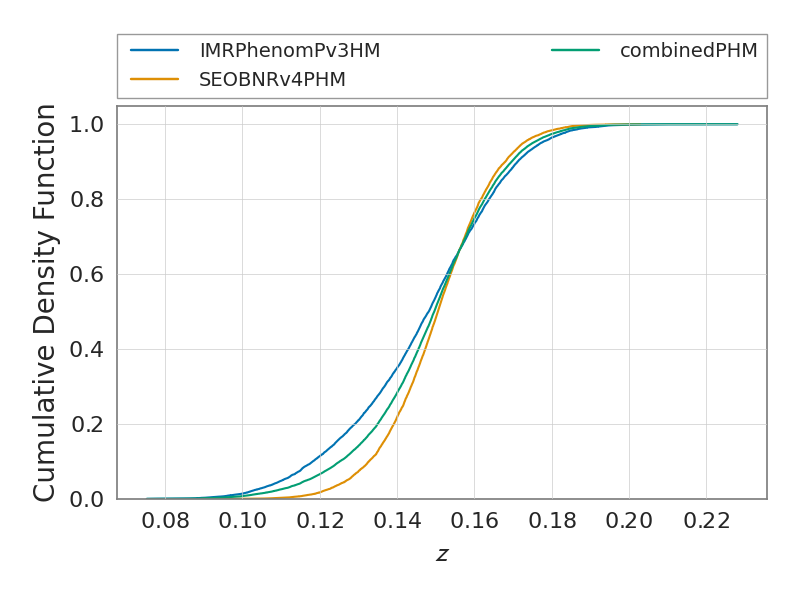
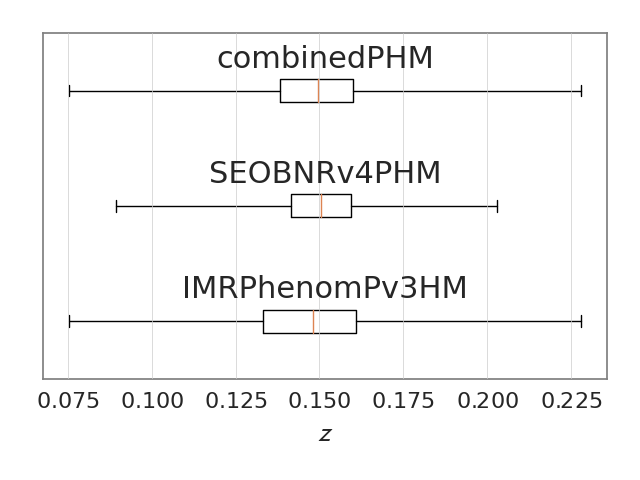
redshift
The figures below show the summary plots for the run
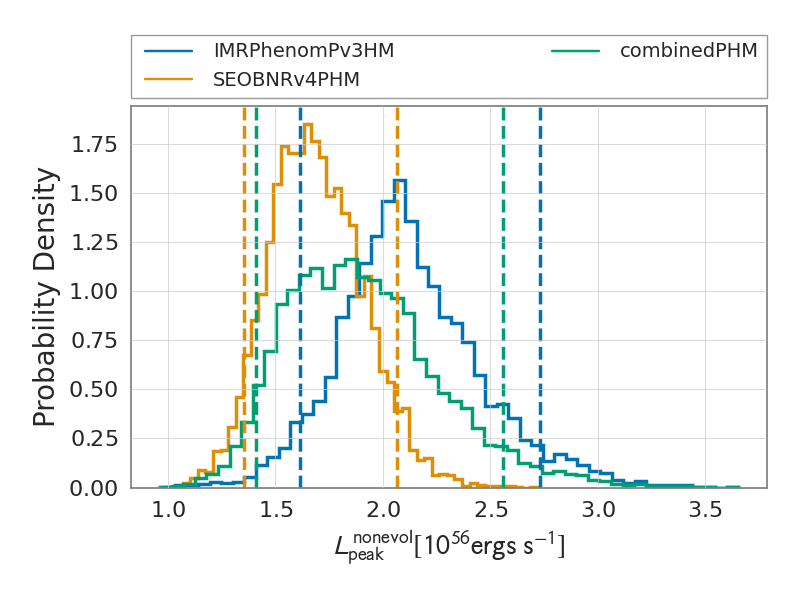
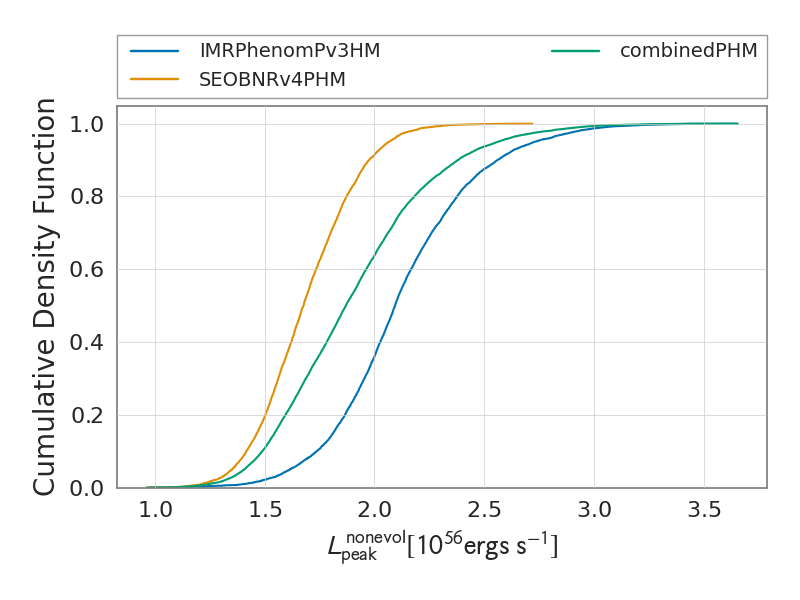
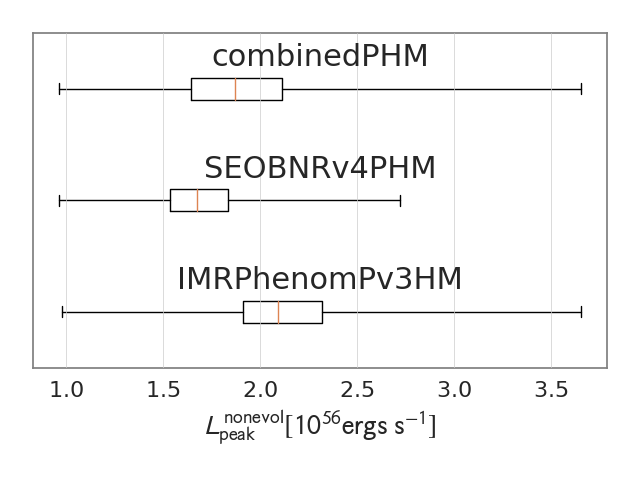
peak_luminosity_non_evolved
The figures below show the summary plots for the run
recalib_H1_frequency_1
The figures below show the summary plots for the run
recalib_V1_frequency_4
The figures below show the summary plots for the run
recalib_V1_amplitude_2
The figures below show the summary plots for the run
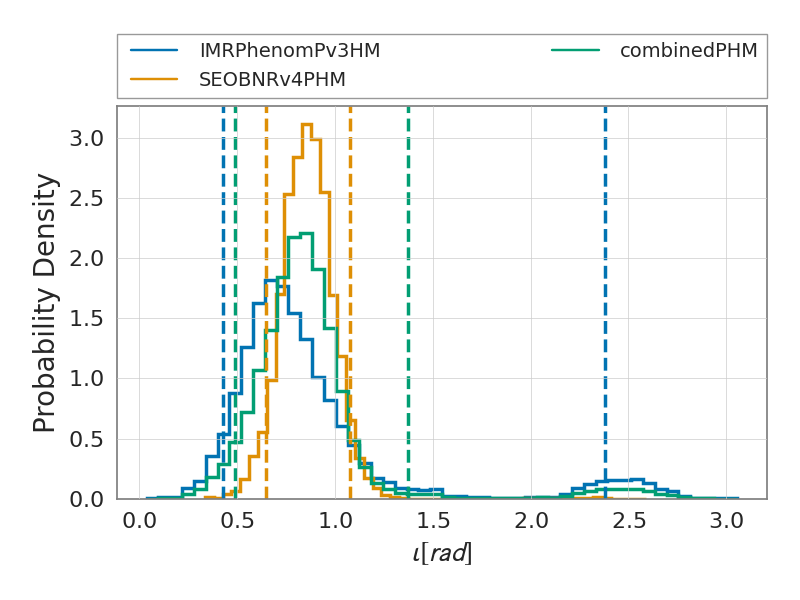
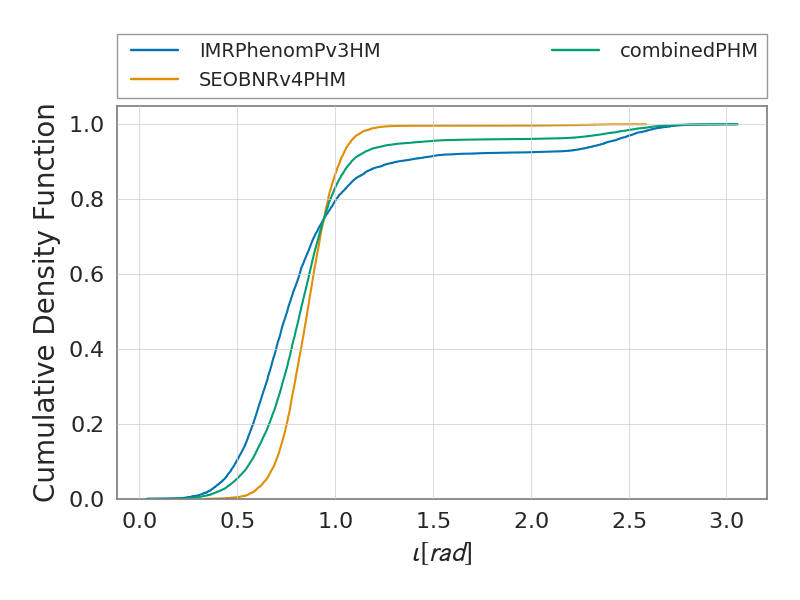
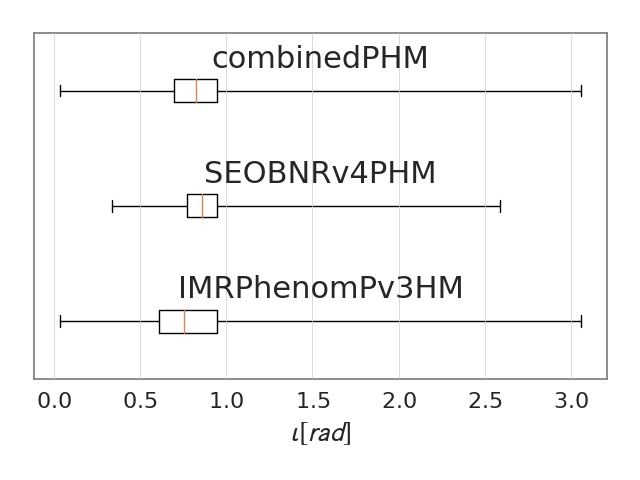
iota
The figures below show the summary plots for the run
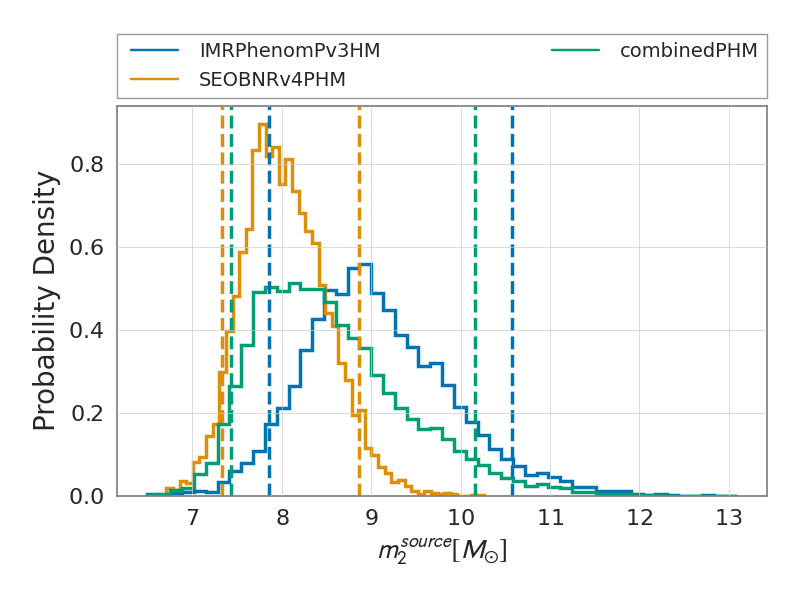
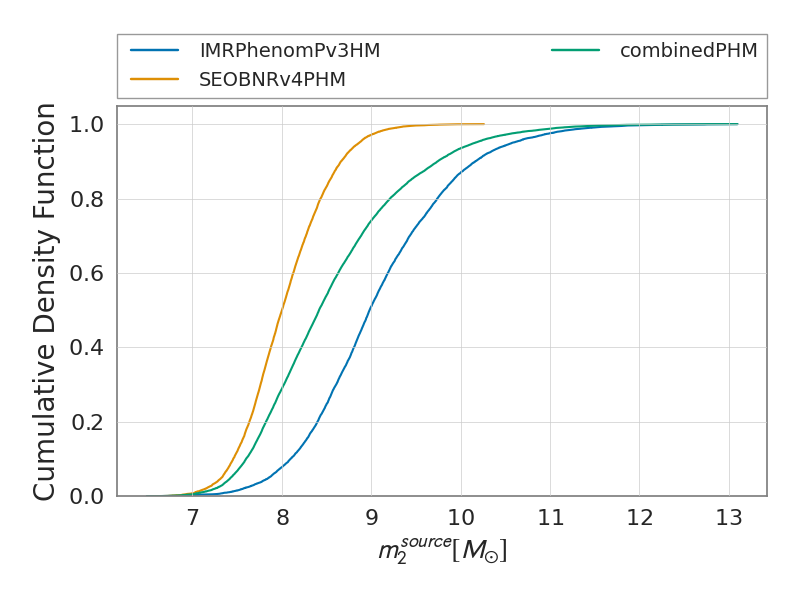
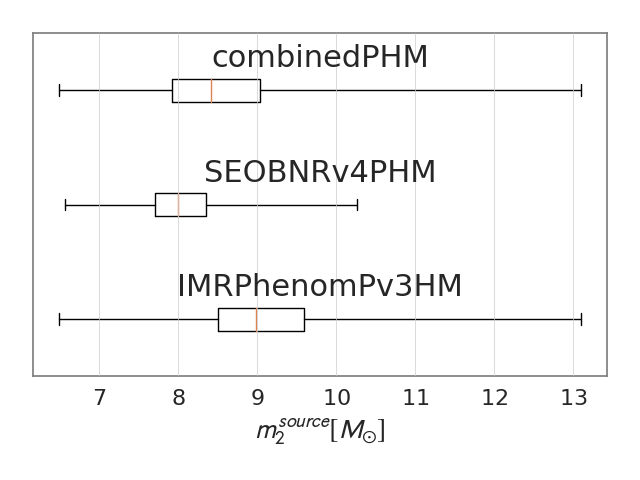
mass_2_source
The figures below show the summary plots for the run
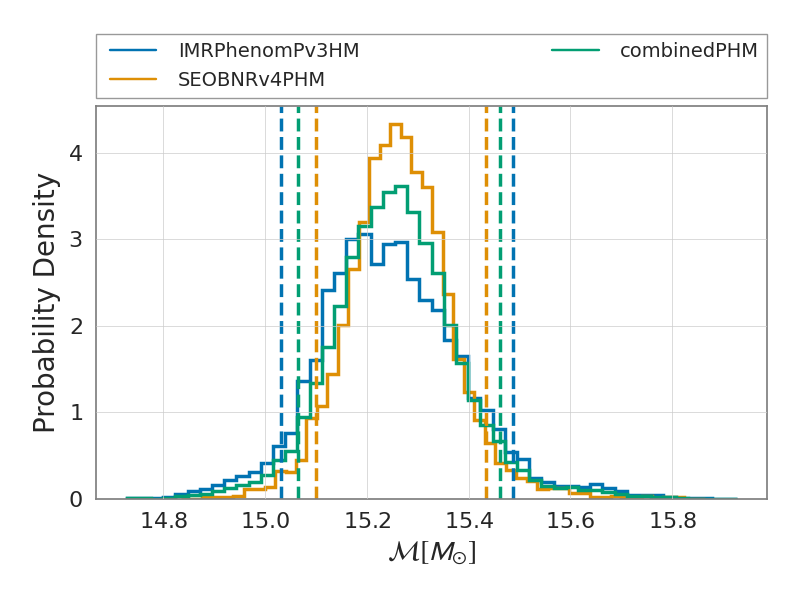
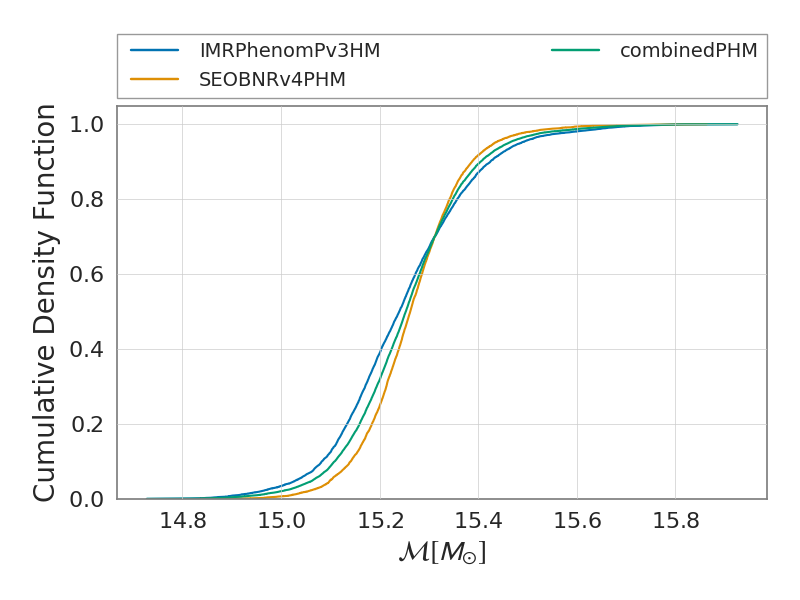
chirp_mass
The figures below show the summary plots for the run
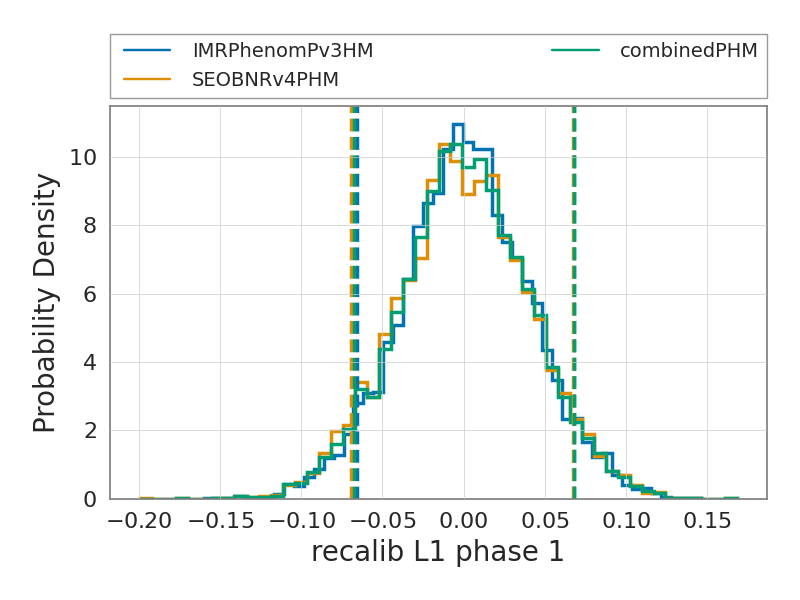
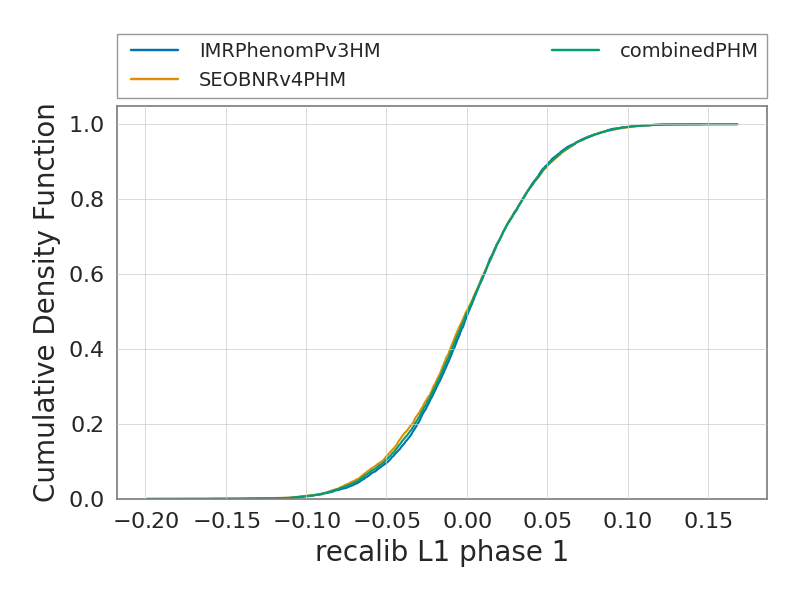
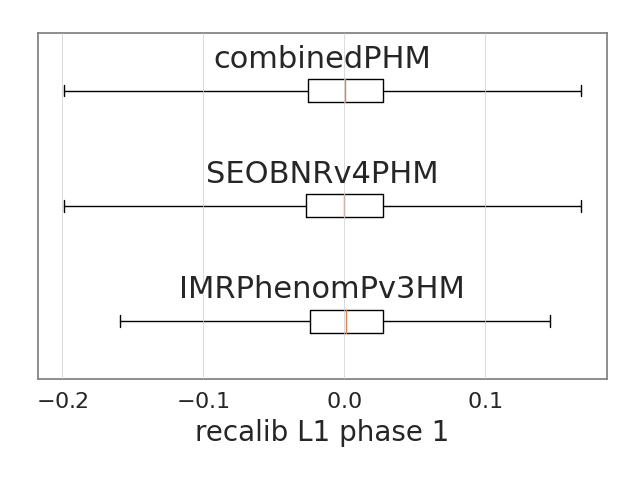
recalib_L1_phase_1
The figures below show the summary plots for the run
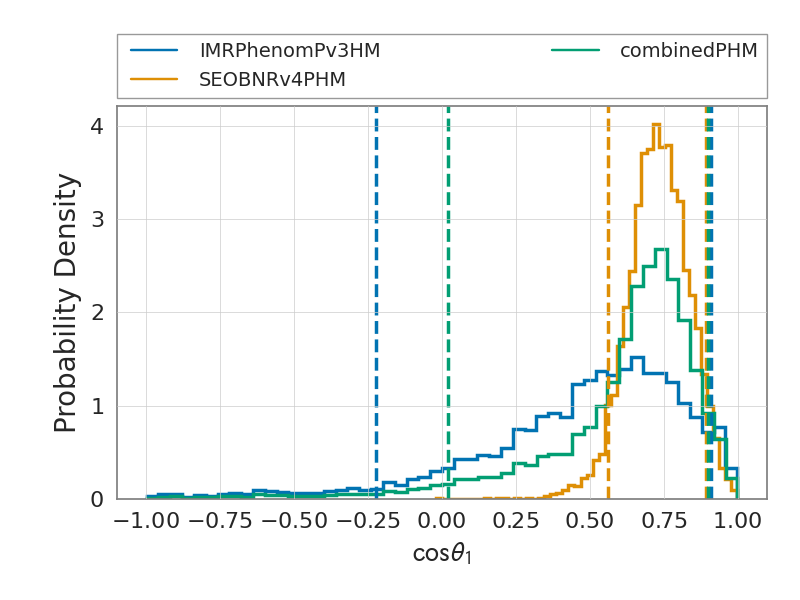
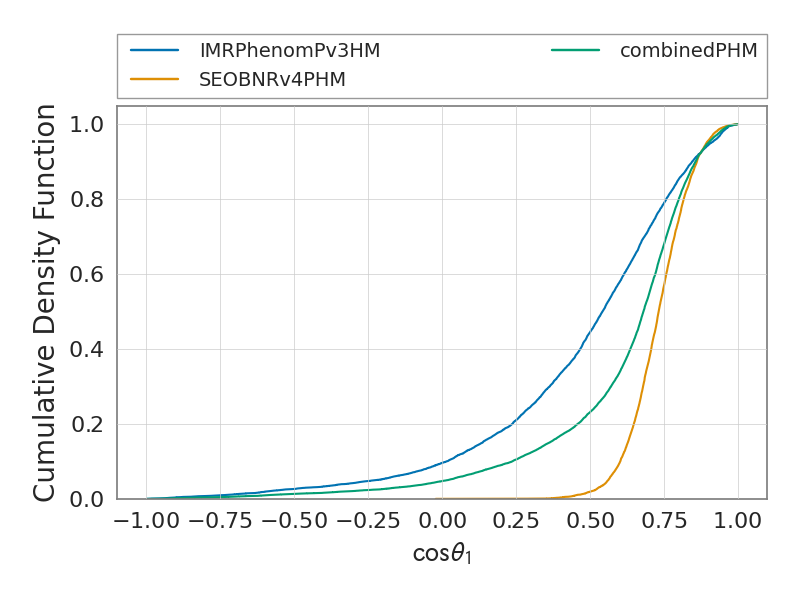
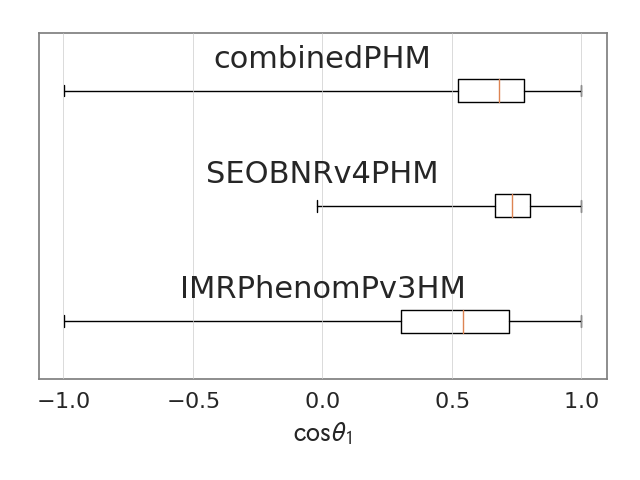
cos_tilt_1
The figures below show the summary plots for the run
recalib_V1_frequency_3
The figures below show the summary plots for the run
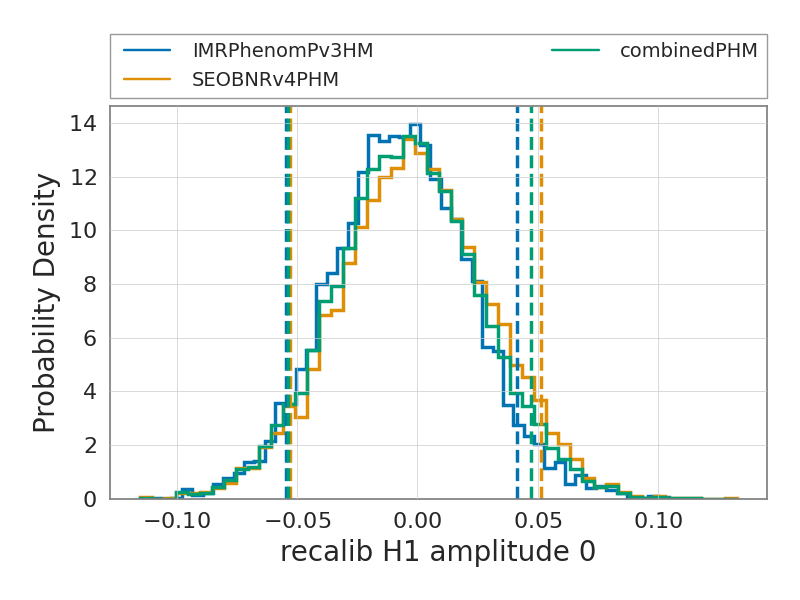
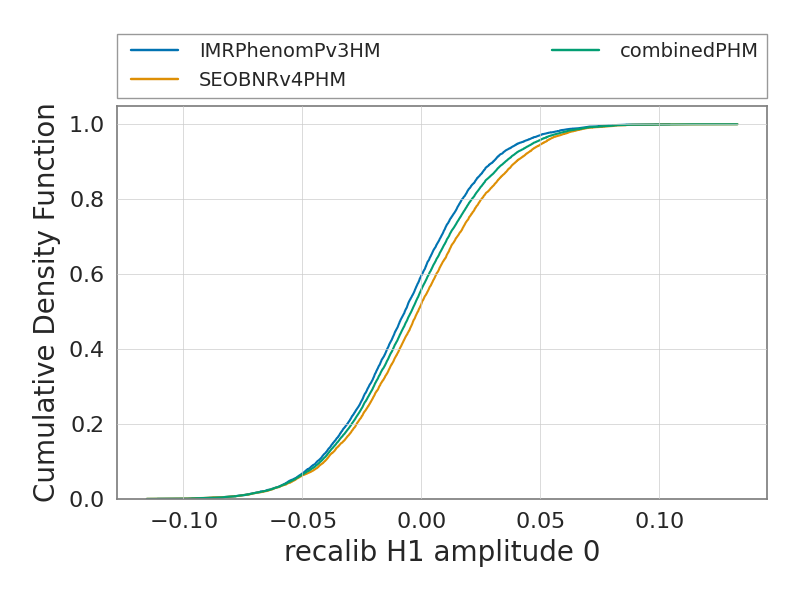
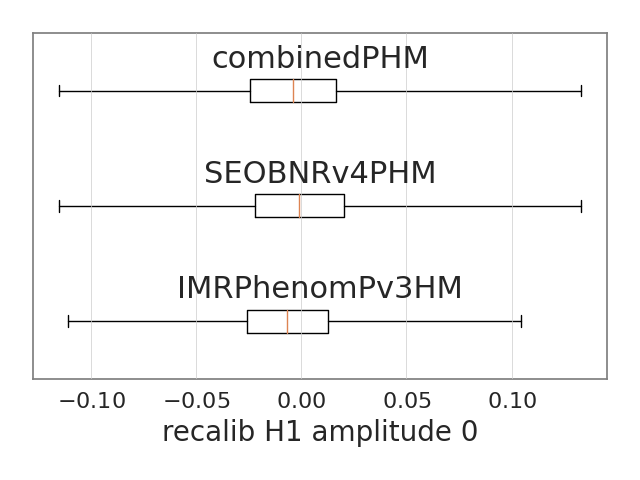
recalib_H1_amplitude_0
The figures below show the summary plots for the run
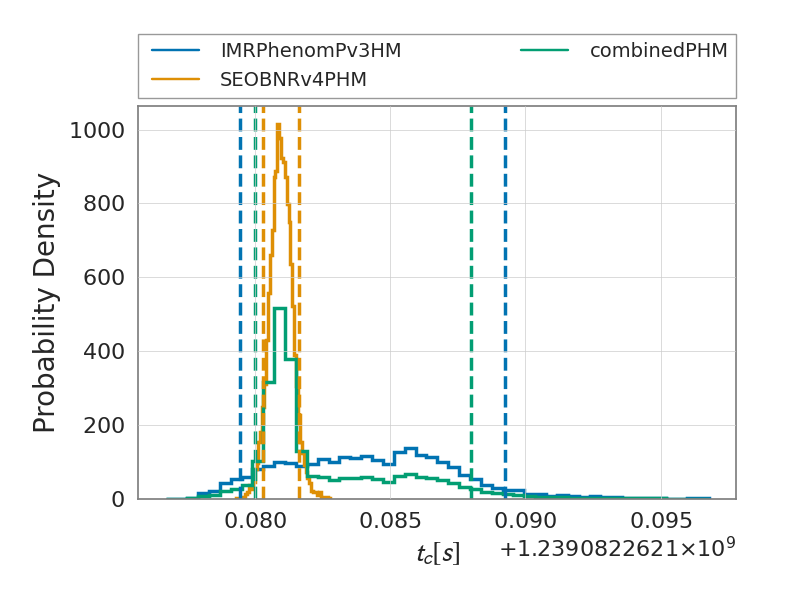
geocent_time
The figures below show the summary plots for the run
recalib_L1_amplitude_8
The figures below show the summary plots for the run
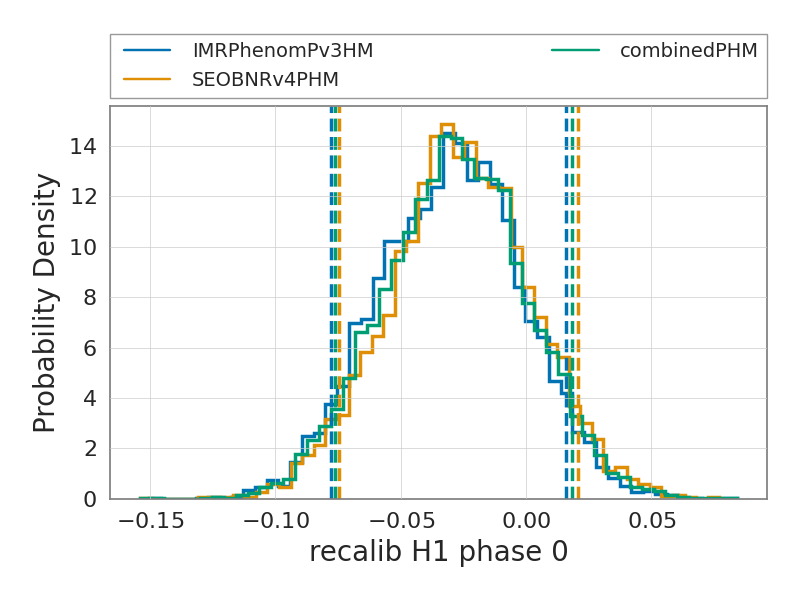
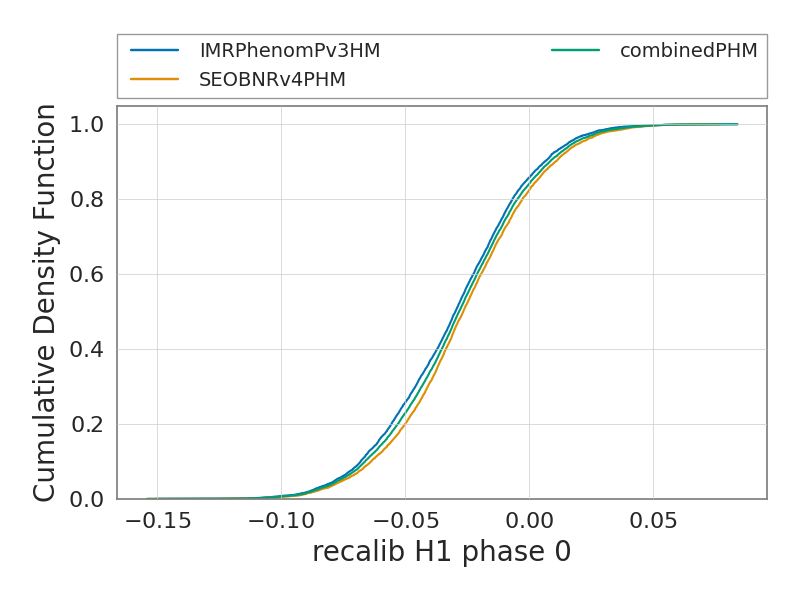
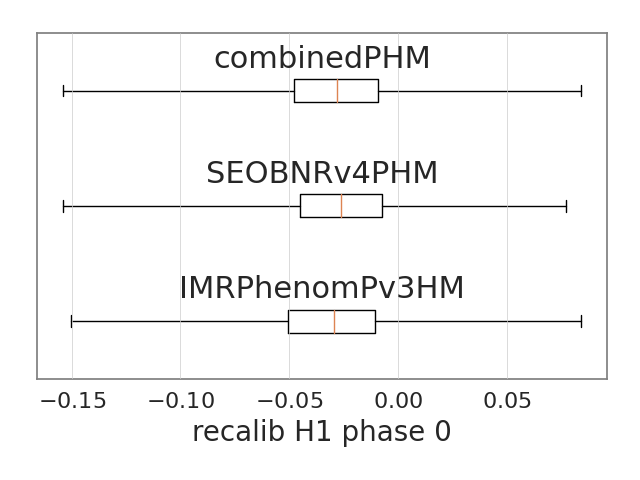
recalib_H1_phase_0
The figures below show the summary plots for the run
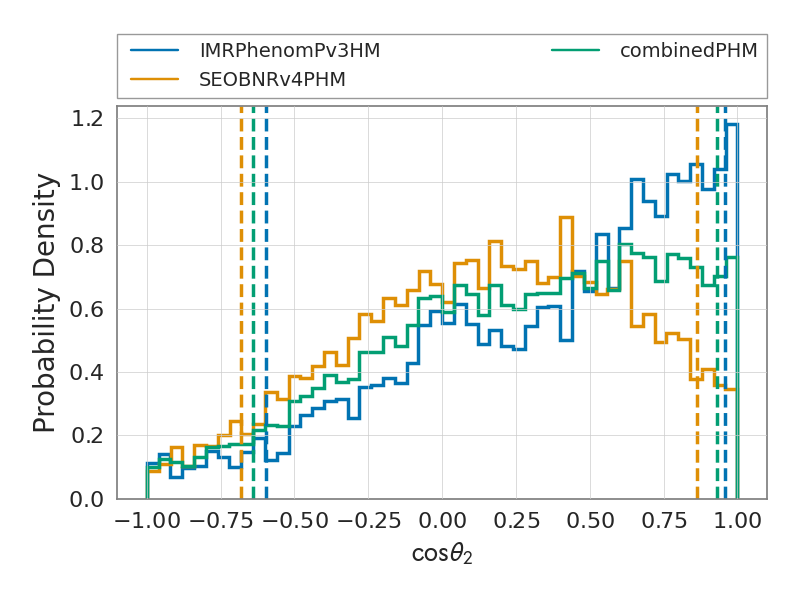
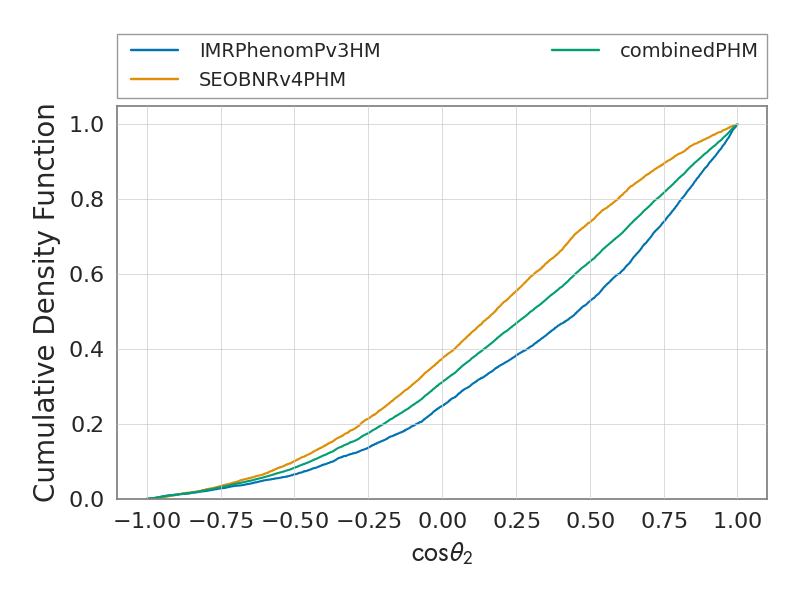
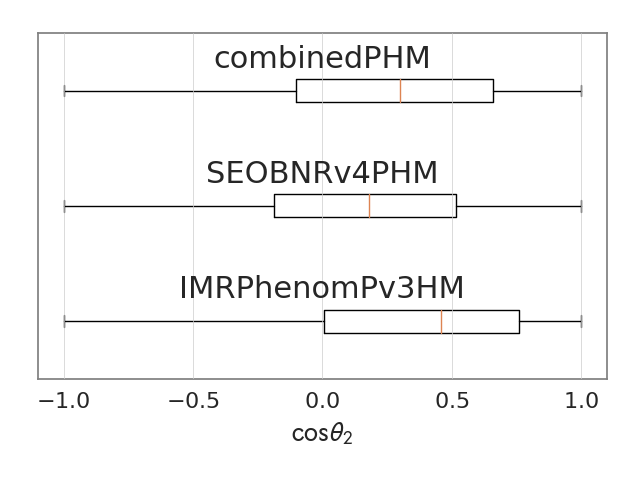
cos_tilt_2
The figures below show the summary plots for the run
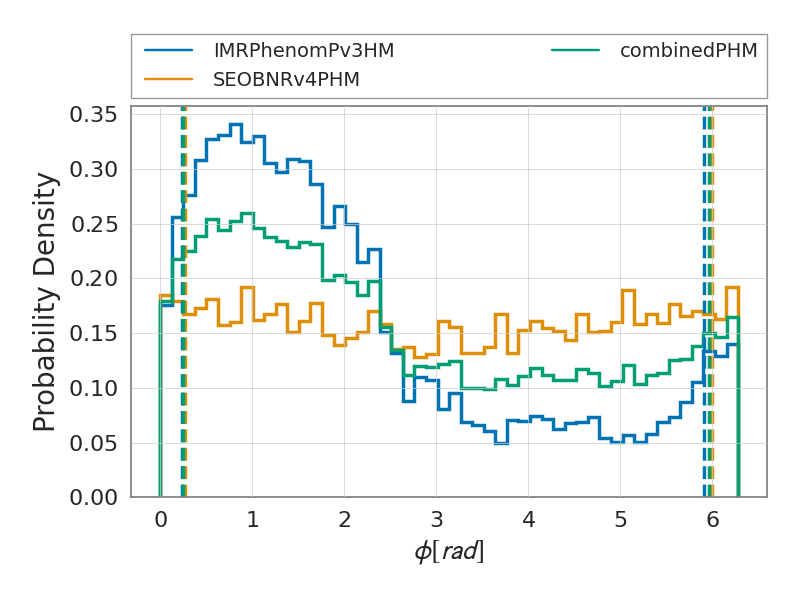
phase
The figures below show the summary plots for the run